French American Indian vs Immigrants from Brazil Married-couple Households
COMPARE
French American Indian
Immigrants from Brazil
Married-couple Households
Married-couple Households Comparison
French American Indians
Immigrants from Brazil
44.1%
MARRIED-COUPLE HOUSEHOLDS
0.4/ 100
METRIC RATING
250th/ 347
METRIC RANK
46.2%
MARRIED-COUPLE HOUSEHOLDS
38.3/ 100
METRIC RATING
183rd/ 347
METRIC RANK
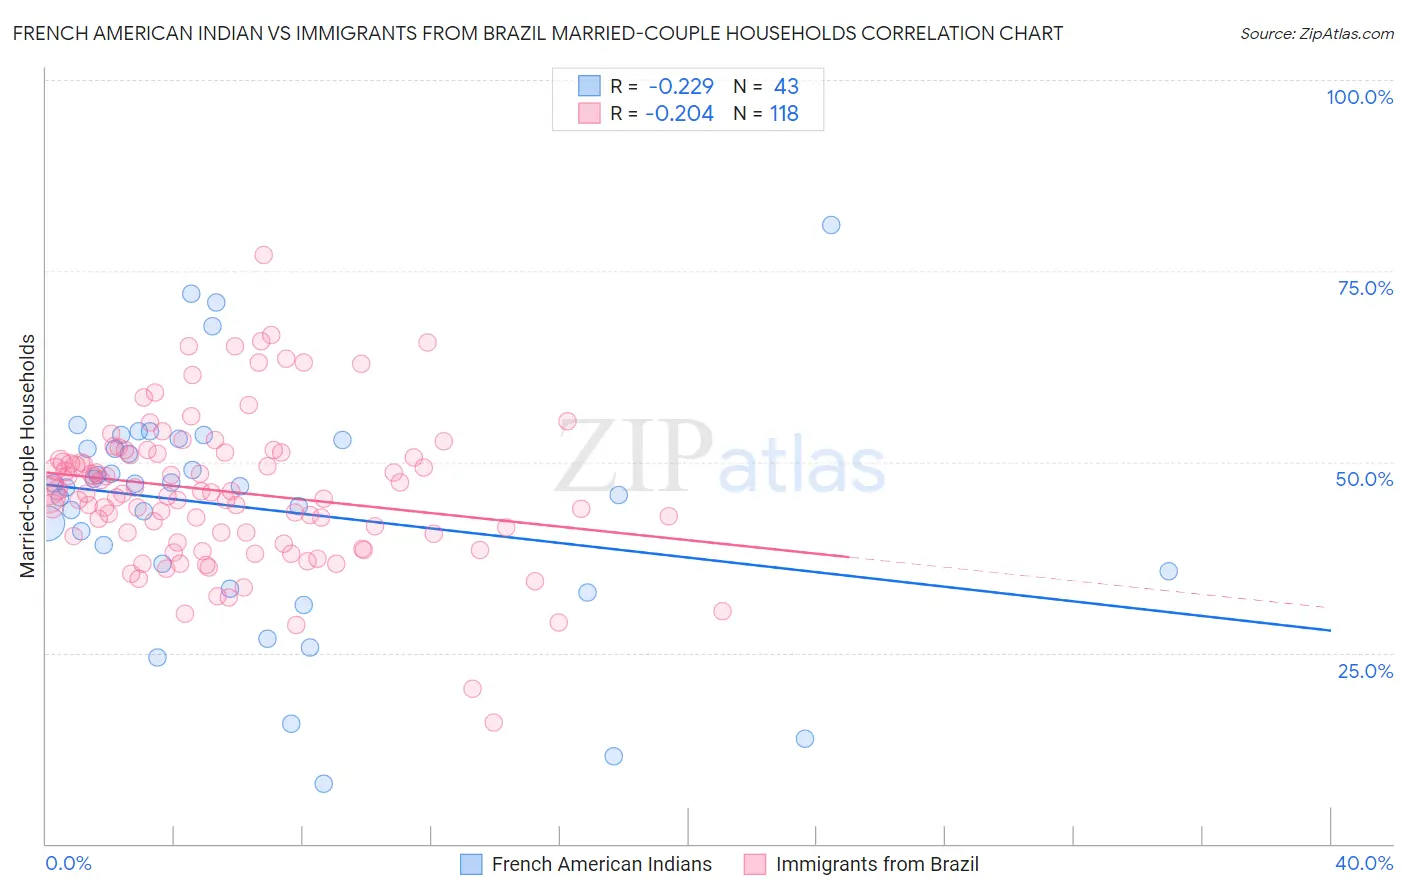
French American Indian vs Immigrants from Brazil Married-couple Households Correlation Chart
The statistical analysis conducted on geographies consisting of 131,960,385 people shows a weak negative correlation between the proportion of French American Indians and percentage of married-couple family households in the United States with a correlation coefficient (R) of -0.229 and weighted average of 44.1%. Similarly, the statistical analysis conducted on geographies consisting of 342,850,397 people shows a weak negative correlation between the proportion of Immigrants from Brazil and percentage of married-couple family households in the United States with a correlation coefficient (R) of -0.204 and weighted average of 46.2%, a difference of 5.0%.
Married-couple Households Correlation Summary
| Measurement | French American Indian | Immigrants from Brazil |
| Minimum | 7.9% | 15.8% |
| Maximum | 81.0% | 77.1% |
| Range | 73.1% | 61.3% |
| Mean | 44.0% | 46.1% |
| Median | 46.8% | 45.9% |
| Interquartile 25% (IQ1) | 35.7% | 40.2% |
| Interquartile 75% (IQ3) | 52.8% | 51.0% |
| Interquartile Range (IQR) | 17.1% | 10.8% |
| Standard Deviation (Sample) | 15.5% | 9.6% |
| Standard Deviation (Population) | 15.3% | 9.6% |
Similar Demographics by Married-couple Households
Demographics Similar to French American Indians by Married-couple Households
In terms of married-couple households, the demographic groups most similar to French American Indians are Immigrants from Kenya (44.1%, a difference of 0.010%), Yup'ik (44.1%, a difference of 0.050%), German Russian (44.0%, a difference of 0.080%), Seminole (44.0%, a difference of 0.15%), and Central American (43.9%, a difference of 0.27%).
| Demographics | Rating | Rank | Married-couple Households |
| Immigrants | Saudi Arabia | 0.9 /100 | #243 | Tragic 44.4% |
| Immigrants | Armenia | 0.7 /100 | #244 | Tragic 44.3% |
| Immigrants | El Salvador | 0.7 /100 | #245 | Tragic 44.3% |
| Immigrants | Cuba | 0.6 /100 | #246 | Tragic 44.2% |
| Immigrants | Morocco | 0.6 /100 | #247 | Tragic 44.2% |
| Yup'ik | 0.4 /100 | #248 | Tragic 44.1% |
| Immigrants | Kenya | 0.4 /100 | #249 | Tragic 44.1% |
| French American Indians | 0.4 /100 | #250 | Tragic 44.1% |
| German Russians | 0.4 /100 | #251 | Tragic 44.0% |
| Seminole | 0.4 /100 | #252 | Tragic 44.0% |
| Central Americans | 0.3 /100 | #253 | Tragic 43.9% |
| Apache | 0.3 /100 | #254 | Tragic 43.9% |
| Shoshone | 0.3 /100 | #255 | Tragic 43.9% |
| Ugandans | 0.3 /100 | #256 | Tragic 43.8% |
| Blackfeet | 0.2 /100 | #257 | Tragic 43.8% |
Demographics Similar to Immigrants from Brazil by Married-couple Households
In terms of married-couple households, the demographic groups most similar to Immigrants from Brazil are Yugoslavian (46.2%, a difference of 0.020%), Immigrants from Switzerland (46.2%, a difference of 0.060%), Brazilian (46.2%, a difference of 0.10%), Malaysian (46.3%, a difference of 0.14%), and Mongolian (46.3%, a difference of 0.15%).
| Demographics | Rating | Rank | Married-couple Households |
| Cajuns | 45.2 /100 | #176 | Average 46.4% |
| Immigrants | Immigrants | 43.8 /100 | #177 | Average 46.3% |
| Immigrants | Costa Rica | 43.4 /100 | #178 | Average 46.3% |
| Immigrants | Zimbabwe | 43.0 /100 | #179 | Average 46.3% |
| Mongolians | 42.0 /100 | #180 | Average 46.3% |
| Malaysians | 41.8 /100 | #181 | Average 46.3% |
| Yugoslavians | 38.9 /100 | #182 | Fair 46.2% |
| Immigrants | Brazil | 38.3 /100 | #183 | Fair 46.2% |
| Immigrants | Switzerland | 36.9 /100 | #184 | Fair 46.2% |
| Brazilians | 35.9 /100 | #185 | Fair 46.2% |
| Albanians | 31.1 /100 | #186 | Fair 46.1% |
| Fijians | 29.2 /100 | #187 | Fair 46.1% |
| South American Indians | 28.4 /100 | #188 | Fair 46.0% |
| Immigrants | Latvia | 26.9 /100 | #189 | Fair 46.0% |
| Immigrants | Kuwait | 25.6 /100 | #190 | Fair 46.0% |