Immigrants from Indonesia vs Immigrants from Brazil Married-couple Households
COMPARE
Immigrants from Indonesia
Immigrants from Brazil
Married-couple Households
Married-couple Households Comparison
Immigrants from Indonesia
Immigrants from Brazil
48.5%
MARRIED-COUPLE HOUSEHOLDS
99.2/ 100
METRIC RATING
58th/ 347
METRIC RANK
46.2%
MARRIED-COUPLE HOUSEHOLDS
38.3/ 100
METRIC RATING
183rd/ 347
METRIC RANK
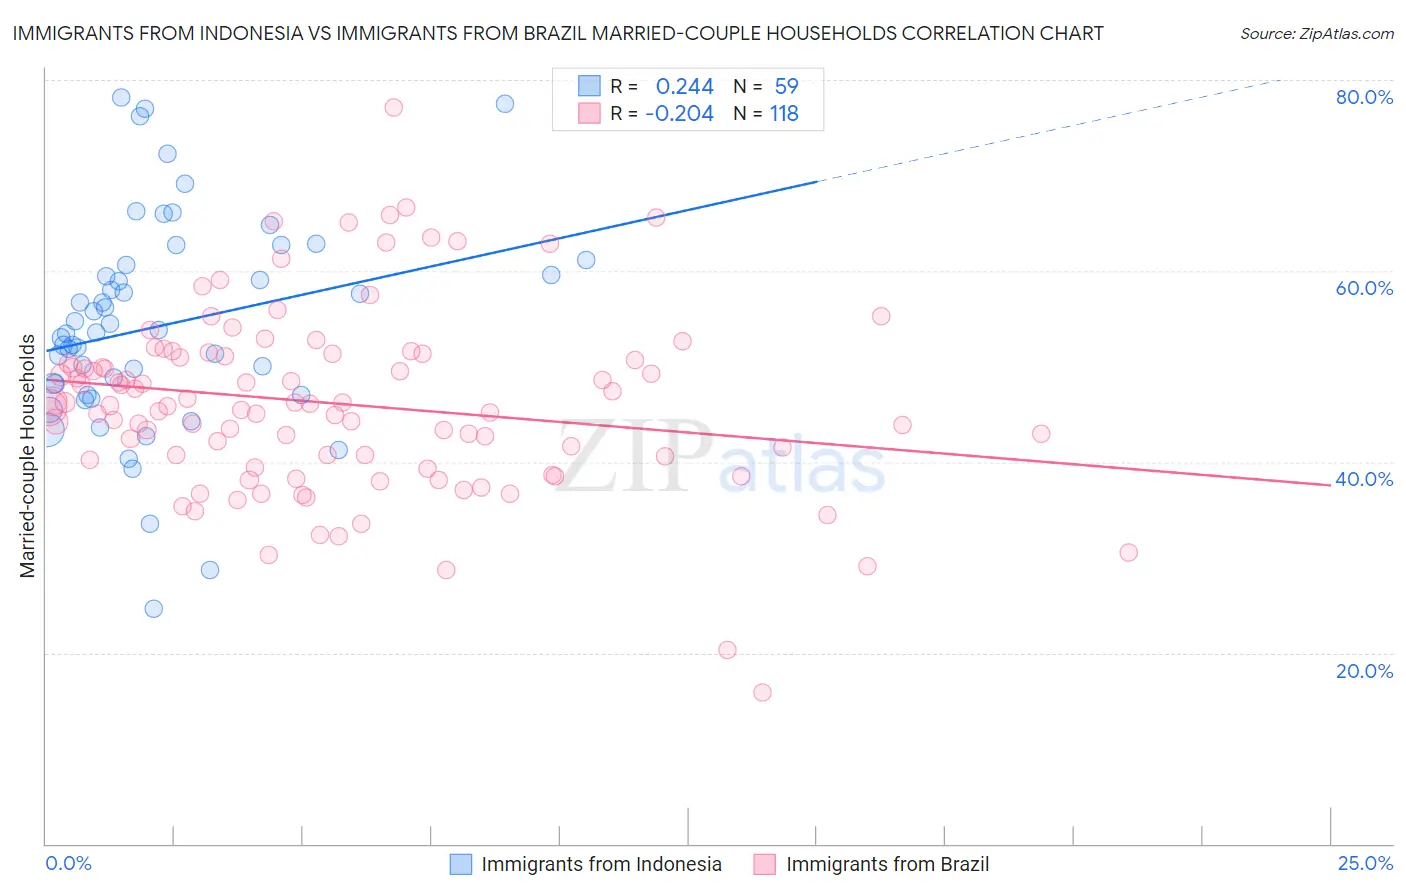
Immigrants from Indonesia vs Immigrants from Brazil Married-couple Households Correlation Chart
The statistical analysis conducted on geographies consisting of 215,718,845 people shows a weak positive correlation between the proportion of Immigrants from Indonesia and percentage of married-couple family households in the United States with a correlation coefficient (R) of 0.244 and weighted average of 48.5%. Similarly, the statistical analysis conducted on geographies consisting of 342,850,397 people shows a weak negative correlation between the proportion of Immigrants from Brazil and percentage of married-couple family households in the United States with a correlation coefficient (R) of -0.204 and weighted average of 46.2%, a difference of 5.0%.
Married-couple Households Correlation Summary
| Measurement | Immigrants from Indonesia | Immigrants from Brazil |
| Minimum | 24.7% | 15.8% |
| Maximum | 78.1% | 77.1% |
| Range | 53.5% | 61.3% |
| Mean | 54.3% | 46.1% |
| Median | 53.5% | 45.9% |
| Interquartile 25% (IQ1) | 47.1% | 40.2% |
| Interquartile 75% (IQ3) | 60.7% | 51.0% |
| Interquartile Range (IQR) | 13.6% | 10.8% |
| Standard Deviation (Sample) | 11.1% | 9.6% |
| Standard Deviation (Population) | 11.0% | 9.6% |
Similar Demographics by Married-couple Households
Demographics Similar to Immigrants from Indonesia by Married-couple Households
In terms of married-couple households, the demographic groups most similar to Immigrants from Indonesia are Polish (48.5%, a difference of 0.0%), Czechoslovakian (48.5%, a difference of 0.0%), Croatian (48.5%, a difference of 0.080%), Austrian (48.6%, a difference of 0.090%), and Immigrants from Northern Europe (48.6%, a difference of 0.090%).
| Demographics | Rating | Rank | Married-couple Households |
| Eastern Europeans | 99.3 /100 | #51 | Exceptional 48.6% |
| Irish | 99.3 /100 | #52 | Exceptional 48.6% |
| Whites/Caucasians | 99.3 /100 | #53 | Exceptional 48.6% |
| Immigrants | Lithuania | 99.3 /100 | #54 | Exceptional 48.6% |
| Austrians | 99.3 /100 | #55 | Exceptional 48.6% |
| Immigrants | Northern Europe | 99.3 /100 | #56 | Exceptional 48.6% |
| Poles | 99.2 /100 | #57 | Exceptional 48.5% |
| Immigrants | Indonesia | 99.2 /100 | #58 | Exceptional 48.5% |
| Czechoslovakians | 99.2 /100 | #59 | Exceptional 48.5% |
| Croatians | 99.1 /100 | #60 | Exceptional 48.5% |
| Bulgarians | 99.1 /100 | #61 | Exceptional 48.5% |
| Luxembourgers | 99.1 /100 | #62 | Exceptional 48.5% |
| Basques | 99.0 /100 | #63 | Exceptional 48.4% |
| Northern Europeans | 99.0 /100 | #64 | Exceptional 48.4% |
| Immigrants | Canada | 99.0 /100 | #65 | Exceptional 48.4% |
Demographics Similar to Immigrants from Brazil by Married-couple Households
In terms of married-couple households, the demographic groups most similar to Immigrants from Brazil are Yugoslavian (46.2%, a difference of 0.020%), Immigrants from Switzerland (46.2%, a difference of 0.060%), Brazilian (46.2%, a difference of 0.10%), Malaysian (46.3%, a difference of 0.14%), and Mongolian (46.3%, a difference of 0.15%).
| Demographics | Rating | Rank | Married-couple Households |
| Cajuns | 45.2 /100 | #176 | Average 46.4% |
| Immigrants | Immigrants | 43.8 /100 | #177 | Average 46.3% |
| Immigrants | Costa Rica | 43.4 /100 | #178 | Average 46.3% |
| Immigrants | Zimbabwe | 43.0 /100 | #179 | Average 46.3% |
| Mongolians | 42.0 /100 | #180 | Average 46.3% |
| Malaysians | 41.8 /100 | #181 | Average 46.3% |
| Yugoslavians | 38.9 /100 | #182 | Fair 46.2% |
| Immigrants | Brazil | 38.3 /100 | #183 | Fair 46.2% |
| Immigrants | Switzerland | 36.9 /100 | #184 | Fair 46.2% |
| Brazilians | 35.9 /100 | #185 | Fair 46.2% |
| Albanians | 31.1 /100 | #186 | Fair 46.1% |
| Fijians | 29.2 /100 | #187 | Fair 46.1% |
| South American Indians | 28.4 /100 | #188 | Fair 46.0% |
| Immigrants | Latvia | 26.9 /100 | #189 | Fair 46.0% |
| Immigrants | Kuwait | 25.6 /100 | #190 | Fair 46.0% |