Cree vs Immigrants from Brazil Married-couple Households
COMPARE
Cree
Immigrants from Brazil
Married-couple Households
Married-couple Households Comparison
Cree
Immigrants from Brazil
43.6%
MARRIED-COUPLE HOUSEHOLDS
0.1/ 100
METRIC RATING
263rd/ 347
METRIC RANK
46.2%
MARRIED-COUPLE HOUSEHOLDS
38.3/ 100
METRIC RATING
183rd/ 347
METRIC RANK
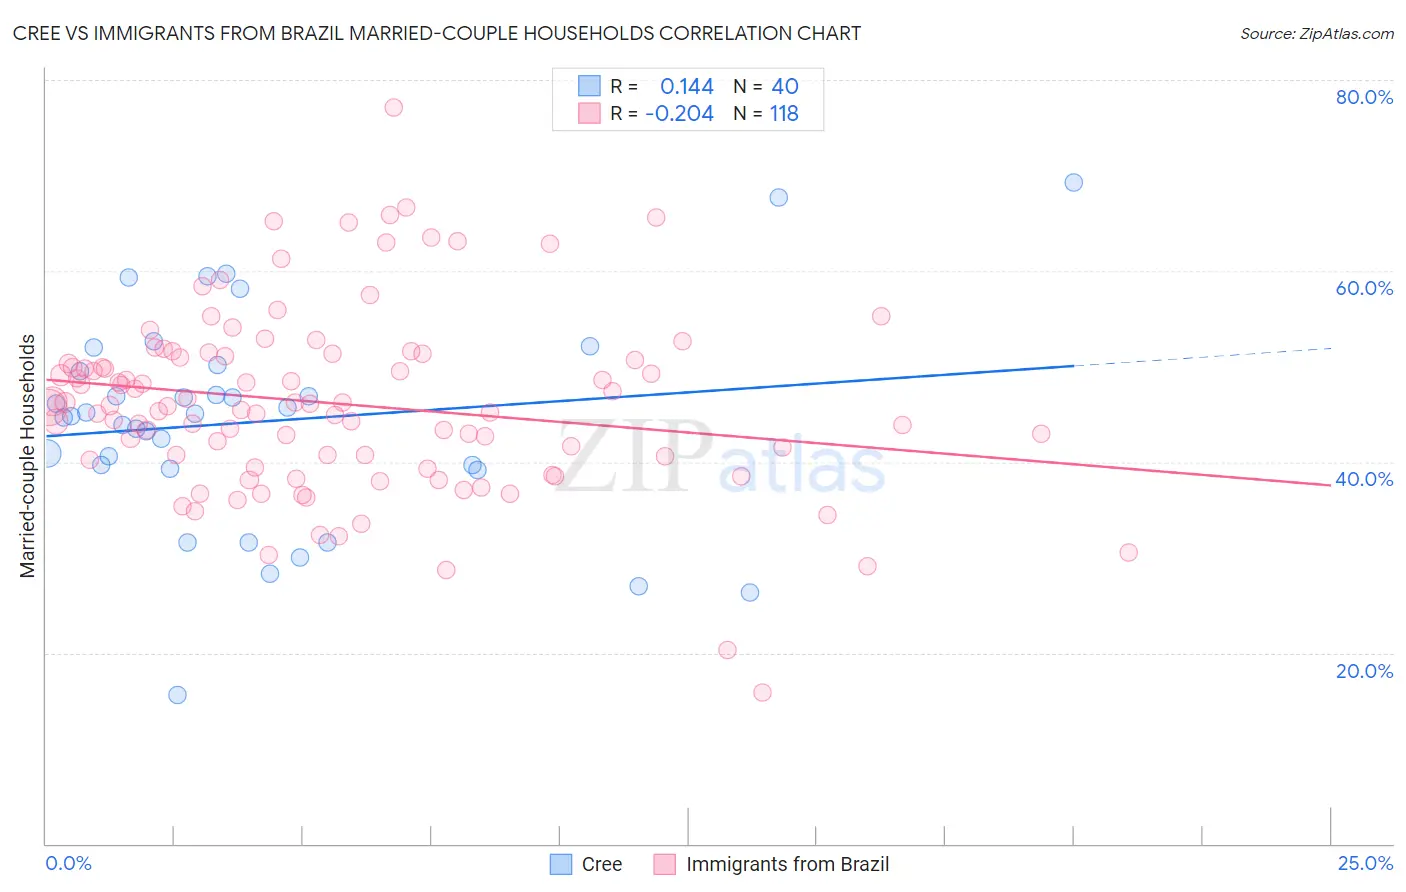
Cree vs Immigrants from Brazil Married-couple Households Correlation Chart
The statistical analysis conducted on geographies consisting of 76,210,632 people shows a poor positive correlation between the proportion of Cree and percentage of married-couple family households in the United States with a correlation coefficient (R) of 0.144 and weighted average of 43.6%. Similarly, the statistical analysis conducted on geographies consisting of 342,850,397 people shows a weak negative correlation between the proportion of Immigrants from Brazil and percentage of married-couple family households in the United States with a correlation coefficient (R) of -0.204 and weighted average of 46.2%, a difference of 6.1%.
Married-couple Households Correlation Summary
| Measurement | Cree | Immigrants from Brazil |
| Minimum | 15.6% | 15.8% |
| Maximum | 69.2% | 77.1% |
| Range | 53.7% | 61.3% |
| Mean | 44.2% | 46.1% |
| Median | 44.9% | 45.9% |
| Interquartile 25% (IQ1) | 39.4% | 40.2% |
| Interquartile 75% (IQ3) | 49.8% | 51.0% |
| Interquartile Range (IQR) | 10.4% | 10.8% |
| Standard Deviation (Sample) | 11.2% | 9.6% |
| Standard Deviation (Population) | 11.0% | 9.6% |
Similar Demographics by Married-couple Households
Demographics Similar to Cree by Married-couple Households
In terms of married-couple households, the demographic groups most similar to Cree are Vietnamese (43.6%, a difference of 0.11%), Bangladeshi (43.5%, a difference of 0.11%), Alaskan Athabascan (43.6%, a difference of 0.17%), Moroccan (43.5%, a difference of 0.19%), and Ecuadorian (43.5%, a difference of 0.23%).
| Demographics | Rating | Rank | Married-couple Households |
| Ugandans | 0.3 /100 | #256 | Tragic 43.8% |
| Blackfeet | 0.2 /100 | #257 | Tragic 43.8% |
| Central American Indians | 0.2 /100 | #258 | Tragic 43.8% |
| Iroquois | 0.2 /100 | #259 | Tragic 43.7% |
| Immigrants | Cameroon | 0.2 /100 | #260 | Tragic 43.7% |
| Alaskan Athabascans | 0.2 /100 | #261 | Tragic 43.6% |
| Vietnamese | 0.2 /100 | #262 | Tragic 43.6% |
| Cree | 0.1 /100 | #263 | Tragic 43.6% |
| Bangladeshis | 0.1 /100 | #264 | Tragic 43.5% |
| Moroccans | 0.1 /100 | #265 | Tragic 43.5% |
| Ecuadorians | 0.1 /100 | #266 | Tragic 43.5% |
| Natives/Alaskans | 0.1 /100 | #267 | Tragic 43.5% |
| Immigrants | Burma/Myanmar | 0.1 /100 | #268 | Tragic 43.4% |
| Immigrants | Sierra Leone | 0.1 /100 | #269 | Tragic 43.3% |
| Yuman | 0.1 /100 | #270 | Tragic 43.3% |
Demographics Similar to Immigrants from Brazil by Married-couple Households
In terms of married-couple households, the demographic groups most similar to Immigrants from Brazil are Yugoslavian (46.2%, a difference of 0.020%), Immigrants from Switzerland (46.2%, a difference of 0.060%), Brazilian (46.2%, a difference of 0.10%), Malaysian (46.3%, a difference of 0.14%), and Mongolian (46.3%, a difference of 0.15%).
| Demographics | Rating | Rank | Married-couple Households |
| Cajuns | 45.2 /100 | #176 | Average 46.4% |
| Immigrants | Immigrants | 43.8 /100 | #177 | Average 46.3% |
| Immigrants | Costa Rica | 43.4 /100 | #178 | Average 46.3% |
| Immigrants | Zimbabwe | 43.0 /100 | #179 | Average 46.3% |
| Mongolians | 42.0 /100 | #180 | Average 46.3% |
| Malaysians | 41.8 /100 | #181 | Average 46.3% |
| Yugoslavians | 38.9 /100 | #182 | Fair 46.2% |
| Immigrants | Brazil | 38.3 /100 | #183 | Fair 46.2% |
| Immigrants | Switzerland | 36.9 /100 | #184 | Fair 46.2% |
| Brazilians | 35.9 /100 | #185 | Fair 46.2% |
| Albanians | 31.1 /100 | #186 | Fair 46.1% |
| Fijians | 29.2 /100 | #187 | Fair 46.1% |
| South American Indians | 28.4 /100 | #188 | Fair 46.0% |
| Immigrants | Latvia | 26.9 /100 | #189 | Fair 46.0% |
| Immigrants | Kuwait | 25.6 /100 | #190 | Fair 46.0% |