Immigrants from Laos vs Puerto Rican Married-couple Households
COMPARE
Immigrants from Laos
Puerto Rican
Married-couple Households
Married-couple Households Comparison
Immigrants from Laos
Puerto Ricans
45.1%
MARRIED-COUPLE HOUSEHOLDS
4.6/ 100
METRIC RATING
222nd/ 347
METRIC RANK
40.1%
MARRIED-COUPLE HOUSEHOLDS
0.0/ 100
METRIC RATING
323rd/ 347
METRIC RANK
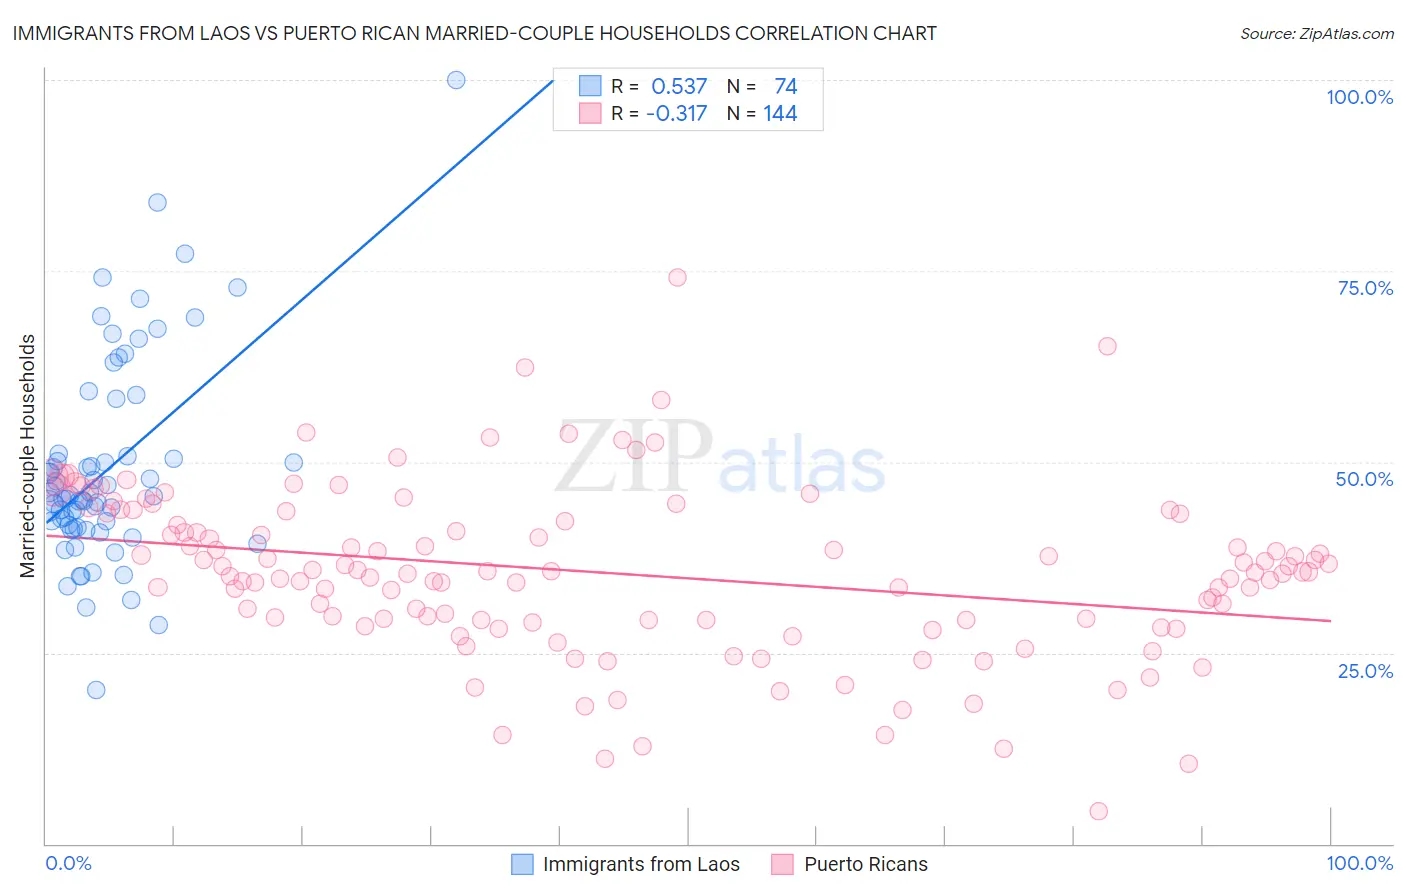
Immigrants from Laos vs Puerto Rican Married-couple Households Correlation Chart
The statistical analysis conducted on geographies consisting of 201,468,663 people shows a substantial positive correlation between the proportion of Immigrants from Laos and percentage of married-couple family households in the United States with a correlation coefficient (R) of 0.537 and weighted average of 45.1%. Similarly, the statistical analysis conducted on geographies consisting of 527,687,187 people shows a mild negative correlation between the proportion of Puerto Ricans and percentage of married-couple family households in the United States with a correlation coefficient (R) of -0.317 and weighted average of 40.1%, a difference of 12.6%.
Married-couple Households Correlation Summary
| Measurement | Immigrants from Laos | Puerto Rican |
| Minimum | 20.1% | 4.2% |
| Maximum | 100.0% | 74.1% |
| Range | 79.9% | 69.9% |
| Mean | 49.0% | 35.4% |
| Median | 45.4% | 35.6% |
| Interquartile 25% (IQ1) | 41.5% | 29.3% |
| Interquartile 75% (IQ3) | 50.7% | 42.7% |
| Interquartile Range (IQR) | 9.2% | 13.4% |
| Standard Deviation (Sample) | 13.5% | 11.0% |
| Standard Deviation (Population) | 13.4% | 11.0% |
Similar Demographics by Married-couple Households
Demographics Similar to Immigrants from Laos by Married-couple Households
In terms of married-couple households, the demographic groups most similar to Immigrants from Laos are Tlingit-Haida (45.1%, a difference of 0.050%), Immigrants from Thailand (45.2%, a difference of 0.10%), Nicaraguan (45.2%, a difference of 0.13%), Immigrants from the Azores (45.2%, a difference of 0.14%), and Panamanian (45.2%, a difference of 0.17%).
| Demographics | Rating | Rank | Married-couple Households |
| Immigrants | Nepal | 5.6 /100 | #215 | Tragic 45.2% |
| Immigrants | Portugal | 5.6 /100 | #216 | Tragic 45.2% |
| Panamanians | 5.5 /100 | #217 | Tragic 45.2% |
| Immigrants | Azores | 5.3 /100 | #218 | Tragic 45.2% |
| Nicaraguans | 5.3 /100 | #219 | Tragic 45.2% |
| Immigrants | Thailand | 5.1 /100 | #220 | Tragic 45.2% |
| Tlingit-Haida | 4.9 /100 | #221 | Tragic 45.1% |
| Immigrants | Laos | 4.6 /100 | #222 | Tragic 45.1% |
| Immigrants | Cambodia | 2.7 /100 | #223 | Tragic 44.9% |
| Immigrants | Micronesia | 2.6 /100 | #224 | Tragic 44.9% |
| Dutch West Indians | 2.6 /100 | #225 | Tragic 44.9% |
| Alsatians | 2.3 /100 | #226 | Tragic 44.8% |
| Salvadorans | 1.9 /100 | #227 | Tragic 44.7% |
| Kenyans | 1.7 /100 | #228 | Tragic 44.7% |
| Immigrants | Latin America | 1.6 /100 | #229 | Tragic 44.7% |
Demographics Similar to Puerto Ricans by Married-couple Households
In terms of married-couple households, the demographic groups most similar to Puerto Ricans are Immigrants from Zaire (40.1%, a difference of 0.0%), Navajo (40.1%, a difference of 0.010%), Pueblo (40.0%, a difference of 0.24%), Immigrants from Liberia (40.3%, a difference of 0.66%), and West Indian (40.3%, a difference of 0.70%).
| Demographics | Rating | Rank | Married-couple Households |
| Immigrants | Caribbean | 0.0 /100 | #316 | Tragic 40.8% |
| Immigrants | Jamaica | 0.0 /100 | #317 | Tragic 40.7% |
| Liberians | 0.0 /100 | #318 | Tragic 40.7% |
| Bahamians | 0.0 /100 | #319 | Tragic 40.5% |
| West Indians | 0.0 /100 | #320 | Tragic 40.3% |
| Immigrants | Liberia | 0.0 /100 | #321 | Tragic 40.3% |
| Immigrants | Zaire | 0.0 /100 | #322 | Tragic 40.1% |
| Puerto Ricans | 0.0 /100 | #323 | Tragic 40.1% |
| Navajo | 0.0 /100 | #324 | Tragic 40.1% |
| Pueblo | 0.0 /100 | #325 | Tragic 40.0% |
| U.S. Virgin Islanders | 0.0 /100 | #326 | Tragic 39.8% |
| Lumbee | 0.0 /100 | #327 | Tragic 39.6% |
| Barbadians | 0.0 /100 | #328 | Tragic 39.4% |
| Immigrants | Dominica | 0.0 /100 | #329 | Tragic 39.4% |
| Immigrants | Barbados | 0.0 /100 | #330 | Tragic 39.2% |