Immigrants from Korea vs Guatemalan Married-couple Households
COMPARE
Immigrants from Korea
Guatemalan
Married-couple Households
Married-couple Households Comparison
Immigrants from Korea
Guatemalans
49.9%
MARRIED-COUPLE HOUSEHOLDS
100.0/ 100
METRIC RATING
13th/ 347
METRIC RANK
43.3%
MARRIED-COUPLE HOUSEHOLDS
0.1/ 100
METRIC RATING
271st/ 347
METRIC RANK
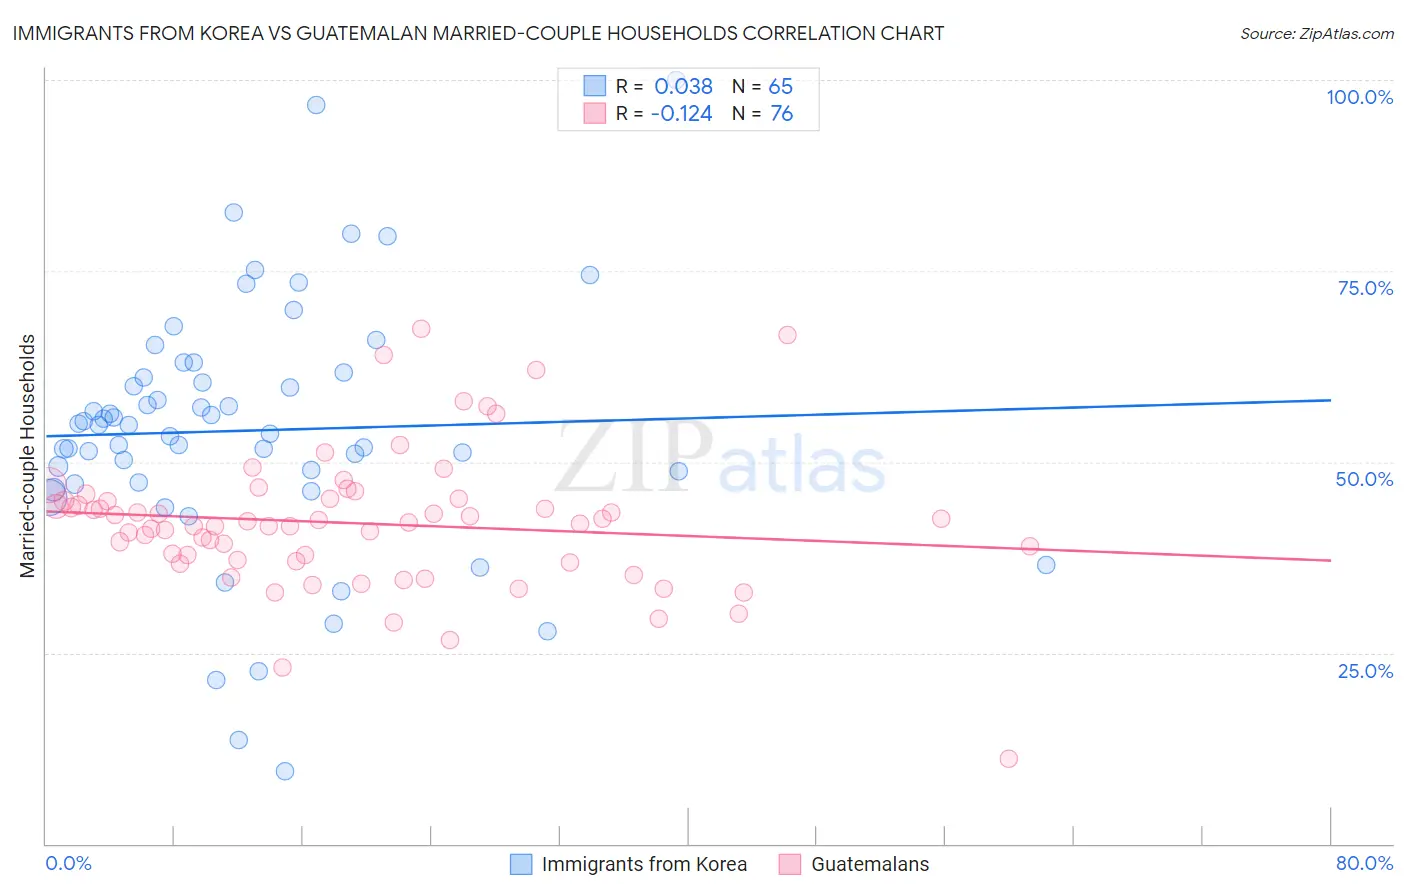
Immigrants from Korea vs Guatemalan Married-couple Households Correlation Chart
The statistical analysis conducted on geographies consisting of 415,948,029 people shows no correlation between the proportion of Immigrants from Korea and percentage of married-couple family households in the United States with a correlation coefficient (R) of 0.038 and weighted average of 49.9%. Similarly, the statistical analysis conducted on geographies consisting of 409,284,876 people shows a poor negative correlation between the proportion of Guatemalans and percentage of married-couple family households in the United States with a correlation coefficient (R) of -0.124 and weighted average of 43.3%, a difference of 15.3%.
Married-couple Households Correlation Summary
| Measurement | Immigrants from Korea | Guatemalan |
| Minimum | 9.4% | 11.2% |
| Maximum | 100.0% | 67.5% |
| Range | 90.6% | 56.3% |
| Mean | 54.1% | 42.0% |
| Median | 54.9% | 41.9% |
| Interquartile 25% (IQ1) | 47.2% | 37.1% |
| Interquartile 75% (IQ3) | 61.4% | 45.1% |
| Interquartile Range (IQR) | 14.2% | 8.0% |
| Standard Deviation (Sample) | 16.7% | 9.1% |
| Standard Deviation (Population) | 16.6% | 9.0% |
Similar Demographics by Married-couple Households
Demographics Similar to Immigrants from Korea by Married-couple Households
In terms of married-couple households, the demographic groups most similar to Immigrants from Korea are Burmese (49.8%, a difference of 0.13%), Swiss (49.9%, a difference of 0.17%), Korean (49.7%, a difference of 0.27%), Swedish (49.7%, a difference of 0.30%), and Immigrants from Hong Kong (49.6%, a difference of 0.46%).
| Demographics | Rating | Rank | Married-couple Households |
| Danes | 100.0 /100 | #6 | Exceptional 51.1% |
| Filipinos | 100.0 /100 | #7 | Exceptional 51.0% |
| Immigrants | South Central Asia | 100.0 /100 | #8 | Exceptional 50.6% |
| Pennsylvania Germans | 100.0 /100 | #9 | Exceptional 50.4% |
| Chinese | 100.0 /100 | #10 | Exceptional 50.4% |
| Immigrants | Pakistan | 100.0 /100 | #11 | Exceptional 50.1% |
| Swiss | 100.0 /100 | #12 | Exceptional 49.9% |
| Immigrants | Korea | 100.0 /100 | #13 | Exceptional 49.9% |
| Burmese | 100.0 /100 | #14 | Exceptional 49.8% |
| Koreans | 99.9 /100 | #15 | Exceptional 49.7% |
| Swedes | 99.9 /100 | #16 | Exceptional 49.7% |
| Immigrants | Hong Kong | 99.9 /100 | #17 | Exceptional 49.6% |
| English | 99.9 /100 | #18 | Exceptional 49.6% |
| Europeans | 99.9 /100 | #19 | Exceptional 49.6% |
| Scandinavians | 99.9 /100 | #20 | Exceptional 49.6% |
Demographics Similar to Guatemalans by Married-couple Households
In terms of married-couple households, the demographic groups most similar to Guatemalans are Yuman (43.3%, a difference of 0.11%), Immigrants from Nigeria (43.2%, a difference of 0.11%), Immigrants from Sierra Leone (43.3%, a difference of 0.15%), Ethiopian (43.2%, a difference of 0.20%), and Nigerian (43.2%, a difference of 0.21%).
| Demographics | Rating | Rank | Married-couple Households |
| Bangladeshis | 0.1 /100 | #264 | Tragic 43.5% |
| Moroccans | 0.1 /100 | #265 | Tragic 43.5% |
| Ecuadorians | 0.1 /100 | #266 | Tragic 43.5% |
| Natives/Alaskans | 0.1 /100 | #267 | Tragic 43.5% |
| Immigrants | Burma/Myanmar | 0.1 /100 | #268 | Tragic 43.4% |
| Immigrants | Sierra Leone | 0.1 /100 | #269 | Tragic 43.3% |
| Yuman | 0.1 /100 | #270 | Tragic 43.3% |
| Guatemalans | 0.1 /100 | #271 | Tragic 43.3% |
| Immigrants | Nigeria | 0.1 /100 | #272 | Tragic 43.2% |
| Ethiopians | 0.1 /100 | #273 | Tragic 43.2% |
| Nigerians | 0.1 /100 | #274 | Tragic 43.2% |
| Immigrants | Bangladesh | 0.0 /100 | #275 | Tragic 43.1% |
| Immigrants | Ethiopia | 0.0 /100 | #276 | Tragic 43.1% |
| Immigrants | Eastern Africa | 0.0 /100 | #277 | Tragic 42.9% |
| Immigrants | Africa | 0.0 /100 | #278 | Tragic 42.9% |