Immigrants from Korea vs Guatemalan Seniors Poverty Over the Age of 75
COMPARE
Immigrants from Korea
Guatemalan
Seniors Poverty Over the Age of 75
Seniors Poverty Over the Age of 75 Comparison
Immigrants from Korea
Guatemalans
12.0%
SENIORS POVERTY OVER THE AGE OF 75
65.5/ 100
METRIC RATING
152nd/ 347
METRIC RANK
14.8%
SENIORS POVERTY OVER THE AGE OF 75
0.0/ 100
METRIC RATING
283rd/ 347
METRIC RANK
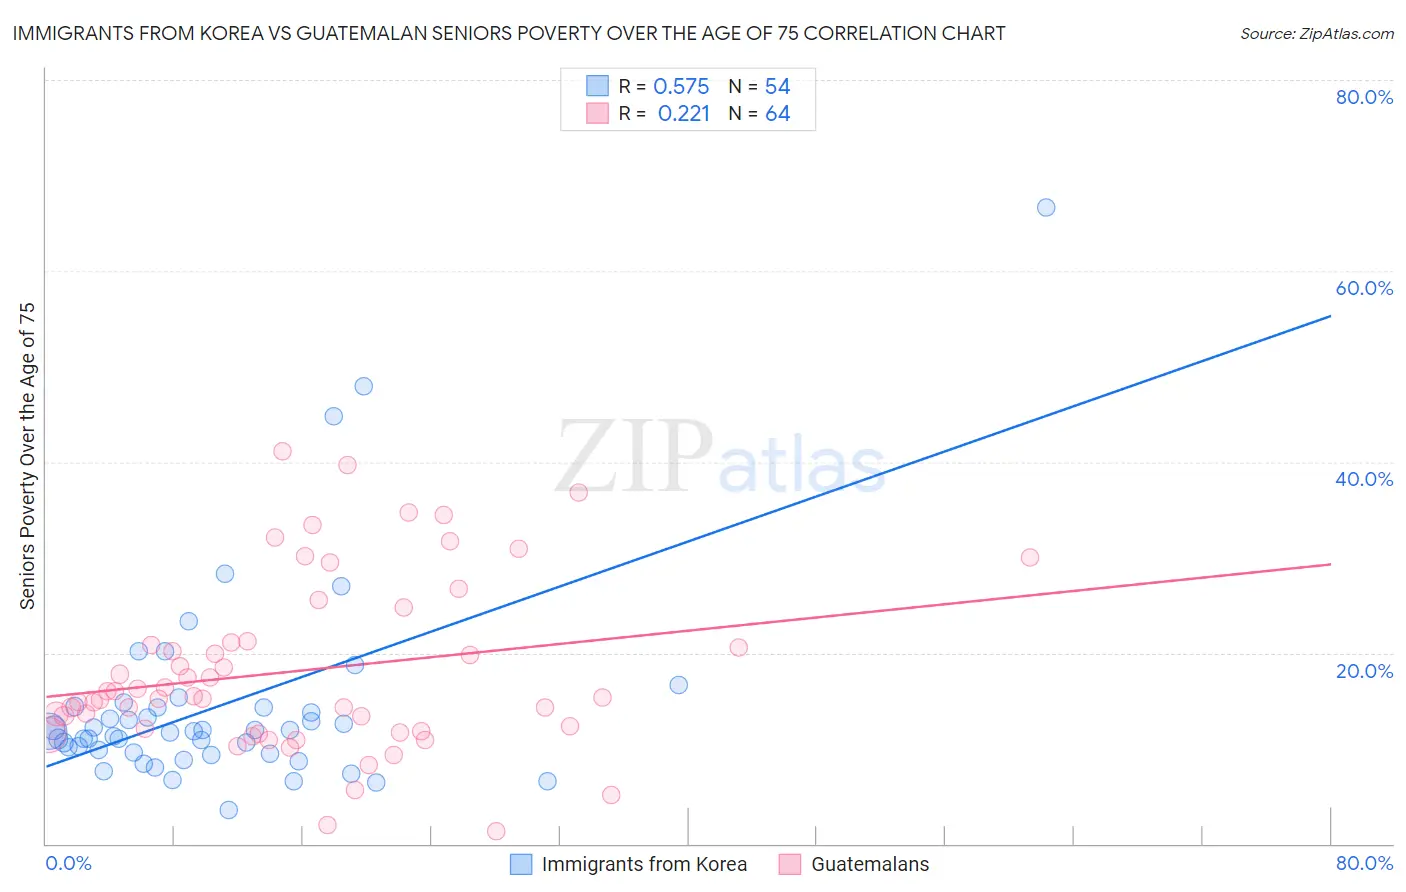
Immigrants from Korea vs Guatemalan Seniors Poverty Over the Age of 75 Correlation Chart
The statistical analysis conducted on geographies consisting of 410,560,504 people shows a substantial positive correlation between the proportion of Immigrants from Korea and poverty level among seniors over the age of 75 in the United States with a correlation coefficient (R) of 0.575 and weighted average of 12.0%. Similarly, the statistical analysis conducted on geographies consisting of 405,055,105 people shows a weak positive correlation between the proportion of Guatemalans and poverty level among seniors over the age of 75 in the United States with a correlation coefficient (R) of 0.221 and weighted average of 14.8%, a difference of 23.0%.
Seniors Poverty Over the Age of 75 Correlation Summary
| Measurement | Immigrants from Korea | Guatemalan |
| Minimum | 3.6% | 1.2% |
| Maximum | 66.7% | 41.1% |
| Range | 63.1% | 39.8% |
| Mean | 14.5% | 18.2% |
| Median | 11.8% | 15.4% |
| Interquartile 25% (IQ1) | 9.6% | 11.9% |
| Interquartile 75% (IQ3) | 14.3% | 21.1% |
| Interquartile Range (IQR) | 4.7% | 9.2% |
| Standard Deviation (Sample) | 10.8% | 9.0% |
| Standard Deviation (Population) | 10.7% | 8.9% |
Similar Demographics by Seniors Poverty Over the Age of 75
Demographics Similar to Immigrants from Korea by Seniors Poverty Over the Age of 75
In terms of seniors poverty over the age of 75, the demographic groups most similar to Immigrants from Korea are Cherokee (12.0%, a difference of 0.030%), Immigrants from Turkey (12.0%, a difference of 0.080%), Cambodian (12.0%, a difference of 0.14%), Cypriot (12.0%, a difference of 0.17%), and Asian (12.0%, a difference of 0.18%).
| Demographics | Rating | Rank | Seniors Poverty Over the Age of 75 |
| Immigrants | Belgium | 70.8 /100 | #145 | Good 12.0% |
| Bangladeshis | 70.4 /100 | #146 | Good 12.0% |
| Immigrants | Latvia | 69.1 /100 | #147 | Good 12.0% |
| Immigrants | Zaire | 67.6 /100 | #148 | Good 12.0% |
| Asians | 67.4 /100 | #149 | Good 12.0% |
| Cypriots | 67.3 /100 | #150 | Good 12.0% |
| Cherokee | 65.8 /100 | #151 | Good 12.0% |
| Immigrants | Korea | 65.5 /100 | #152 | Good 12.0% |
| Immigrants | Turkey | 64.7 /100 | #153 | Good 12.0% |
| Cambodians | 64.0 /100 | #154 | Good 12.0% |
| Indonesians | 62.6 /100 | #155 | Good 12.1% |
| Immigrants | Burma/Myanmar | 62.3 /100 | #156 | Good 12.1% |
| Immigrants | Sudan | 61.7 /100 | #157 | Good 12.1% |
| Portuguese | 61.3 /100 | #158 | Good 12.1% |
| Immigrants | Middle Africa | 61.2 /100 | #159 | Good 12.1% |
Demographics Similar to Guatemalans by Seniors Poverty Over the Age of 75
In terms of seniors poverty over the age of 75, the demographic groups most similar to Guatemalans are Immigrants from Senegal (14.8%, a difference of 0.060%), Belizean (14.8%, a difference of 0.24%), Central American (14.7%, a difference of 0.35%), Cheyenne (14.9%, a difference of 0.64%), and Immigrants from Mexico (14.9%, a difference of 0.83%).
| Demographics | Rating | Rank | Seniors Poverty Over the Age of 75 |
| Soviet Union | 0.0 /100 | #276 | Tragic 14.5% |
| Senegalese | 0.0 /100 | #277 | Tragic 14.5% |
| Immigrants | Colombia | 0.0 /100 | #278 | Tragic 14.6% |
| Blacks/African Americans | 0.0 /100 | #279 | Tragic 14.6% |
| Central Americans | 0.0 /100 | #280 | Tragic 14.7% |
| Belizeans | 0.0 /100 | #281 | Tragic 14.8% |
| Immigrants | Senegal | 0.0 /100 | #282 | Tragic 14.8% |
| Guatemalans | 0.0 /100 | #283 | Tragic 14.8% |
| Cheyenne | 0.0 /100 | #284 | Tragic 14.9% |
| Immigrants | Mexico | 0.0 /100 | #285 | Tragic 14.9% |
| Immigrants | Central America | 0.0 /100 | #286 | Tragic 15.0% |
| Immigrants | Guatemala | 0.0 /100 | #287 | Tragic 15.1% |
| Jamaicans | 0.0 /100 | #288 | Tragic 15.1% |
| Immigrants | Belize | 0.0 /100 | #289 | Tragic 15.2% |
| Immigrants | Azores | 0.0 /100 | #290 | Tragic 15.2% |