French vs Guatemalan Married-couple Households
COMPARE
French
Guatemalan
Married-couple Households
Married-couple Households Comparison
French
Guatemalans
48.0%
MARRIED-COUPLE HOUSEHOLDS
97.2/ 100
METRIC RATING
90th/ 347
METRIC RANK
43.3%
MARRIED-COUPLE HOUSEHOLDS
0.1/ 100
METRIC RATING
271st/ 347
METRIC RANK
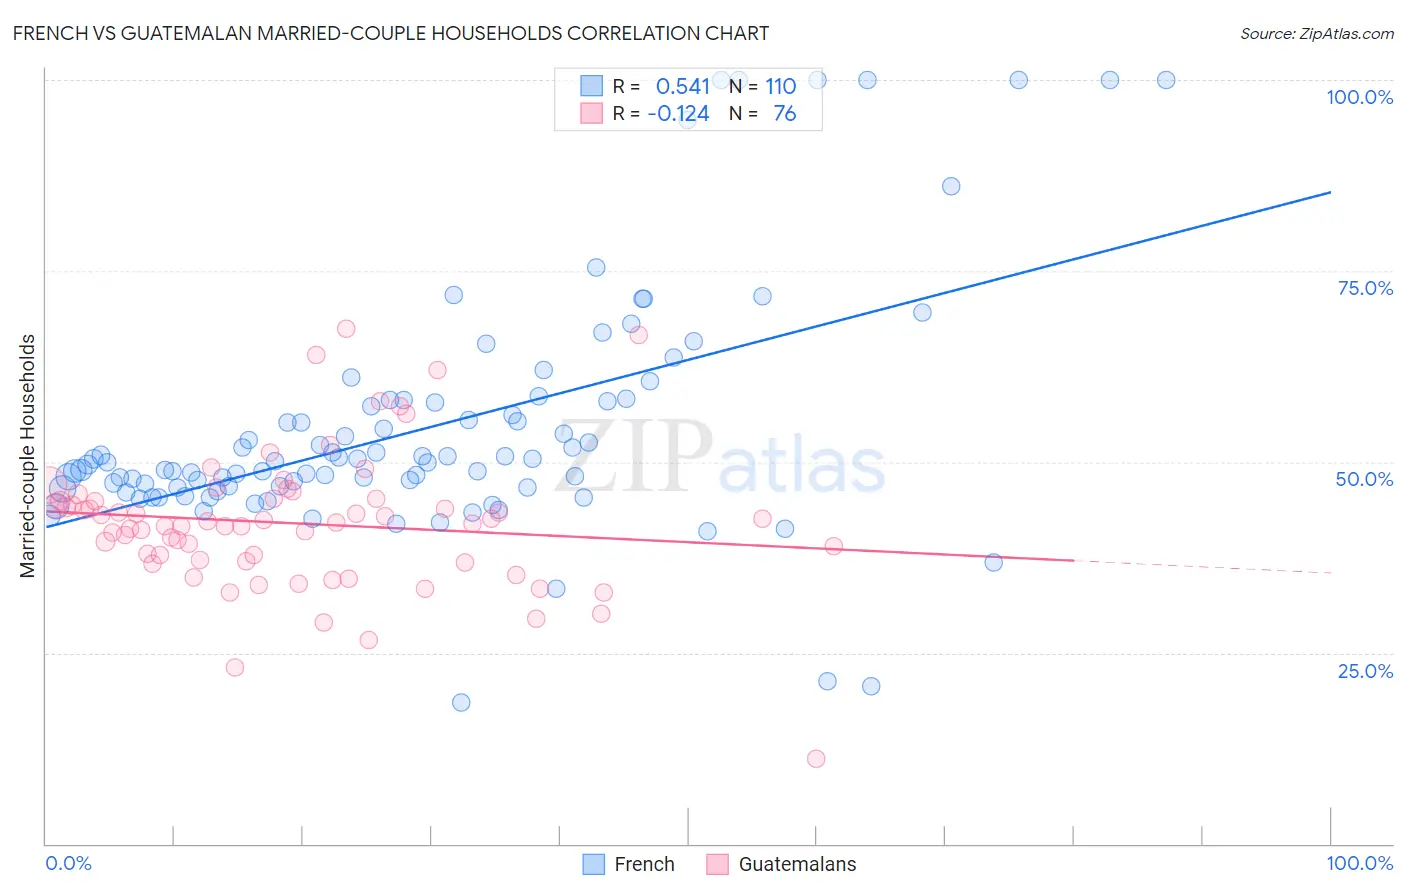
French vs Guatemalan Married-couple Households Correlation Chart
The statistical analysis conducted on geographies consisting of 571,775,805 people shows a substantial positive correlation between the proportion of French and percentage of married-couple family households in the United States with a correlation coefficient (R) of 0.541 and weighted average of 48.0%. Similarly, the statistical analysis conducted on geographies consisting of 409,284,876 people shows a poor negative correlation between the proportion of Guatemalans and percentage of married-couple family households in the United States with a correlation coefficient (R) of -0.124 and weighted average of 43.3%, a difference of 11.0%.
Married-couple Households Correlation Summary
| Measurement | French | Guatemalan |
| Minimum | 18.5% | 11.2% |
| Maximum | 100.0% | 67.5% |
| Range | 81.5% | 56.3% |
| Mean | 54.4% | 42.0% |
| Median | 49.9% | 41.9% |
| Interquartile 25% (IQ1) | 46.7% | 37.1% |
| Interquartile 75% (IQ3) | 57.9% | 45.1% |
| Interquartile Range (IQR) | 11.2% | 8.0% |
| Standard Deviation (Sample) | 16.0% | 9.1% |
| Standard Deviation (Population) | 15.9% | 9.0% |
Similar Demographics by Married-couple Households
Demographics Similar to French by Married-couple Households
In terms of married-couple households, the demographic groups most similar to French are Cypriot (48.0%, a difference of 0.010%), Afghan (48.0%, a difference of 0.040%), Immigrants from Ireland (48.0%, a difference of 0.050%), Belgian (48.0%, a difference of 0.060%), and Immigrants from Moldova (48.0%, a difference of 0.060%).
| Demographics | Rating | Rank | Married-couple Households |
| Guamanians/Chamorros | 97.6 /100 | #83 | Exceptional 48.1% |
| Ukrainians | 97.6 /100 | #84 | Exceptional 48.1% |
| Immigrants | Israel | 97.4 /100 | #85 | Exceptional 48.0% |
| Belgians | 97.4 /100 | #86 | Exceptional 48.0% |
| Immigrants | Ireland | 97.3 /100 | #87 | Exceptional 48.0% |
| Afghans | 97.3 /100 | #88 | Exceptional 48.0% |
| Cypriots | 97.2 /100 | #89 | Exceptional 48.0% |
| French | 97.2 /100 | #90 | Exceptional 48.0% |
| Immigrants | Moldova | 97.0 /100 | #91 | Exceptional 48.0% |
| Palestinians | 96.9 /100 | #92 | Exceptional 48.0% |
| Lebanese | 96.9 /100 | #93 | Exceptional 47.9% |
| Americans | 96.9 /100 | #94 | Exceptional 47.9% |
| Immigrants | Belgium | 96.8 /100 | #95 | Exceptional 47.9% |
| Immigrants | Egypt | 96.6 /100 | #96 | Exceptional 47.9% |
| Latvians | 96.5 /100 | #97 | Exceptional 47.9% |
Demographics Similar to Guatemalans by Married-couple Households
In terms of married-couple households, the demographic groups most similar to Guatemalans are Yuman (43.3%, a difference of 0.11%), Immigrants from Nigeria (43.2%, a difference of 0.11%), Immigrants from Sierra Leone (43.3%, a difference of 0.15%), Ethiopian (43.2%, a difference of 0.20%), and Nigerian (43.2%, a difference of 0.21%).
| Demographics | Rating | Rank | Married-couple Households |
| Bangladeshis | 0.1 /100 | #264 | Tragic 43.5% |
| Moroccans | 0.1 /100 | #265 | Tragic 43.5% |
| Ecuadorians | 0.1 /100 | #266 | Tragic 43.5% |
| Natives/Alaskans | 0.1 /100 | #267 | Tragic 43.5% |
| Immigrants | Burma/Myanmar | 0.1 /100 | #268 | Tragic 43.4% |
| Immigrants | Sierra Leone | 0.1 /100 | #269 | Tragic 43.3% |
| Yuman | 0.1 /100 | #270 | Tragic 43.3% |
| Guatemalans | 0.1 /100 | #271 | Tragic 43.3% |
| Immigrants | Nigeria | 0.1 /100 | #272 | Tragic 43.2% |
| Ethiopians | 0.1 /100 | #273 | Tragic 43.2% |
| Nigerians | 0.1 /100 | #274 | Tragic 43.2% |
| Immigrants | Bangladesh | 0.0 /100 | #275 | Tragic 43.1% |
| Immigrants | Ethiopia | 0.0 /100 | #276 | Tragic 43.1% |
| Immigrants | Eastern Africa | 0.0 /100 | #277 | Tragic 42.9% |
| Immigrants | Africa | 0.0 /100 | #278 | Tragic 42.9% |