Immigrants from Kazakhstan vs Immigrants from Sri Lanka 2nd Grade
COMPARE
Immigrants from Kazakhstan
Immigrants from Sri Lanka
2nd Grade
2nd Grade Comparison
Immigrants from Kazakhstan
Immigrants from Sri Lanka
97.8%
2ND GRADE
35.6/ 100
METRIC RATING
188th/ 347
METRIC RANK
97.9%
2ND GRADE
48.7/ 100
METRIC RATING
176th/ 347
METRIC RANK
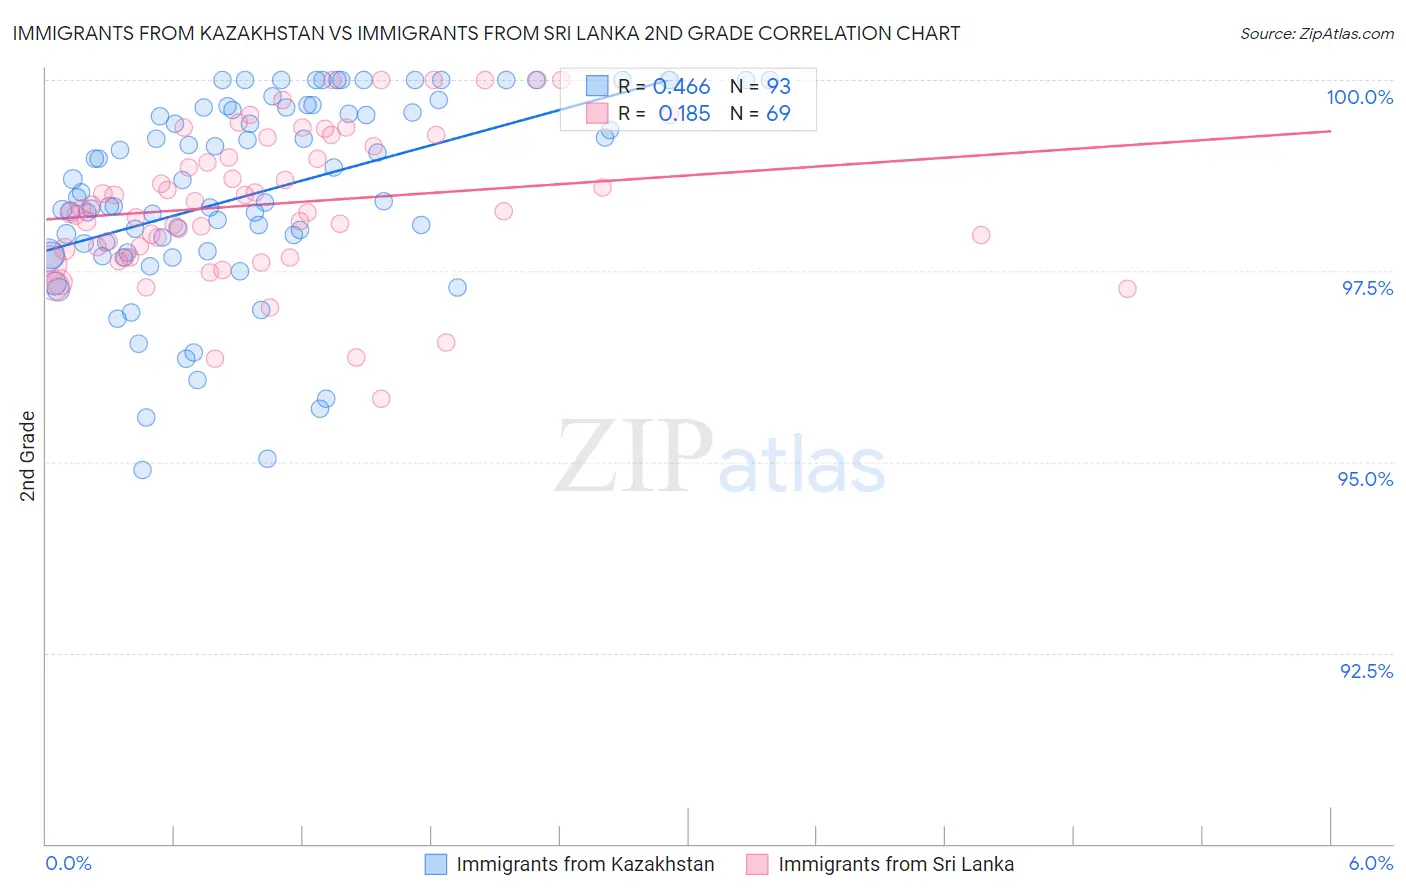
Immigrants from Kazakhstan vs Immigrants from Sri Lanka 2nd Grade Correlation Chart
The statistical analysis conducted on geographies consisting of 124,444,388 people shows a moderate positive correlation between the proportion of Immigrants from Kazakhstan and percentage of population with at least 2nd grade education in the United States with a correlation coefficient (R) of 0.466 and weighted average of 97.8%. Similarly, the statistical analysis conducted on geographies consisting of 149,700,552 people shows a poor positive correlation between the proportion of Immigrants from Sri Lanka and percentage of population with at least 2nd grade education in the United States with a correlation coefficient (R) of 0.185 and weighted average of 97.9%, a difference of 0.040%.
2nd Grade Correlation Summary
| Measurement | Immigrants from Kazakhstan | Immigrants from Sri Lanka |
| Minimum | 94.9% | 95.8% |
| Maximum | 100.0% | 100.0% |
| Range | 5.1% | 4.2% |
| Mean | 98.5% | 98.4% |
| Median | 98.5% | 98.3% |
| Interquartile 25% (IQ1) | 97.8% | 97.7% |
| Interquartile 75% (IQ3) | 99.6% | 99.2% |
| Interquartile Range (IQR) | 1.9% | 1.5% |
| Standard Deviation (Sample) | 1.3% | 0.95% |
| Standard Deviation (Population) | 1.3% | 0.94% |
Demographics Similar to Immigrants from Kazakhstan and Immigrants from Sri Lanka by 2nd Grade
In terms of 2nd grade, the demographic groups most similar to Immigrants from Kazakhstan are Arab (97.8%, a difference of 0.0%), Pakistani (97.8%, a difference of 0.0%), Panamanian (97.8%, a difference of 0.010%), Immigrants from Taiwan (97.8%, a difference of 0.010%), and Portuguese (97.8%, a difference of 0.020%). Similarly, the demographic groups most similar to Immigrants from Sri Lanka are Immigrants from Micronesia (97.9%, a difference of 0.0%), Immigrants from Bosnia and Herzegovina (97.9%, a difference of 0.0%), Immigrants from Korea (97.9%, a difference of 0.010%), Kenyan (97.9%, a difference of 0.010%), and Immigrants from Brazil (97.9%, a difference of 0.010%).
| Demographics | Rating | Rank | 2nd Grade |
| Immigrants | Korea | 52.7 /100 | #172 | Average 97.9% |
| Kenyans | 52.7 /100 | #173 | Average 97.9% |
| Immigrants | Micronesia | 50.0 /100 | #174 | Average 97.9% |
| Immigrants | Bosnia and Herzegovina | 49.8 /100 | #175 | Average 97.9% |
| Immigrants | Sri Lanka | 48.7 /100 | #176 | Average 97.9% |
| Immigrants | Brazil | 46.6 /100 | #177 | Average 97.9% |
| Argentineans | 46.3 /100 | #178 | Average 97.9% |
| Immigrants | Venezuela | 46.1 /100 | #179 | Average 97.9% |
| Natives/Alaskans | 44.3 /100 | #180 | Average 97.9% |
| Egyptians | 44.3 /100 | #181 | Average 97.9% |
| Portuguese | 42.4 /100 | #182 | Average 97.8% |
| Immigrants | Poland | 42.2 /100 | #183 | Average 97.8% |
| Immigrants | Belarus | 41.5 /100 | #184 | Average 97.8% |
| Immigrants | Argentina | 40.6 /100 | #185 | Average 97.8% |
| Arabs | 36.9 /100 | #186 | Fair 97.8% |
| Pakistanis | 36.1 /100 | #187 | Fair 97.8% |
| Immigrants | Kazakhstan | 35.6 /100 | #188 | Fair 97.8% |
| Panamanians | 33.5 /100 | #189 | Fair 97.8% |
| Immigrants | Taiwan | 31.8 /100 | #190 | Fair 97.8% |
| Paraguayans | 30.8 /100 | #191 | Fair 97.8% |
| Blacks/African Americans | 29.9 /100 | #192 | Fair 97.8% |