Immigrants from Israel vs Immigrants from Northern Europe Married-couple Households

COMPARE

Immigrants from Israel
Race
Ancestry
AfghanAfricanAlaska NativeAlaskan AthabascanAlbanianAleutAlsatianAmericanApacheArabArapahoArgentineanArmenianAssyrian/Chaldean/SyriacAustralianAustrianBahamianBangladeshiBarbadianBasqueBelgianBelizeanBermudanBhutaneseBlackfeetBolivianBrazilianBritishBritish West IndianBulgarianBurmeseCajunCambodianCanadianCape VerdeanCarpatho RusynCelticCentral AmericanCentral American IndianCherokeeCheyenneChickasawChileanChineseChippewaChoctawColombianColvilleComancheCosta RicanCreeCreekCroatianCrowCubanCypriotCzechCzechoslovakianDanishDelawareDominicanDutchDutch West IndianEastern EuropeanEcuadorianEgyptianEnglishEstonianEthiopianEuropeanFijianFilipinoFinnishFrenchFrench American IndianFrench CanadianGermanGerman RussianGhanaianGreekGuamanian/ChamorroGuatemalanGuyaneseHaitianHmongHonduranHopiHoumaHungarianIcelanderIndian (Asian)IndonesianInupiatIranianIraqiIrishIroquoisIsraeliItalianJamaicanJapaneseJordanianKenyanKiowaKoreanLaotianLatvianLebaneseLiberianLithuanianLumbeeLuxembourgerMacedonianMalaysianMalteseMarshalleseMenomineeMexicanMexican American IndianMongolianMoroccanNative HawaiianNavajoNepaleseNew ZealanderNicaraguanNigerianNorthern EuropeanNorwegianOkinawanOsageOttawaPaiutePakistaniPalestinianPanamanianParaguayanPennsylvania GermanPeruvianPimaPolishPortuguesePotawatomiPuebloPuerto RicanPuget Sound SalishRomanianRussianSalvadoranSamoanScandinavianScotch-IrishScottishSeminoleSenegaleseSerbianShoshoneSierra LeoneanSiouxSlavicSlovakSloveneSomaliSouth AfricanSouth AmericanSouth American IndianSoviet UnionSpaniardSpanishSpanish AmericanSpanish American IndianSri LankanSubsaharan AfricanSudaneseSwedishSwissSyrianTaiwaneseThaiTlingit-HaidaTohono O'OdhamTonganTrinidadian and TobagonianTsimshianTurkishU.S. Virgin IslanderUgandanUkrainianUruguayanUteVenezuelanVietnameseWelshWest IndianYakamaYaquiYugoslavianYumanYup'ikZimbabwean
Immigration
NonimmigrantsImmigrantsAfghanistanAfricaAlbaniaArgentinaArmeniaAsiaAustraliaAustriaBahamasBangladeshBarbadosBelarusBelgiumBelizeBoliviaBosnia and HerzegovinaBrazilBulgariaBurma/MyanmarCabo VerdeCambodiaCameroonCanadaCaribbeanCentral AmericaChileChinaColombiaCongoCosta RicaCroatiaCubaCzechoslovakiaDenmarkDominicaDominican RepublicEastern AfricaEastern AsiaEastern EuropeEcuadorEgyptEl SalvadorEnglandEritreaEthiopiaEuropeFijiFranceGermanyGhanaGreeceGrenadaGuatemalaGuyanaHaitiHondurasHong KongHungaryIndiaIndonesiaIranIraqIrelandIsraelItalyJamaicaJapanJordanKazakhstanKenyaKoreaKuwaitLaosLatin AmericaLatviaLebanonLiberiaLithuaniaMalaysiaMexicoMicronesiaMiddle AfricaMoldovaMoroccoNepalNetherlandsNicaraguaNigeriaNorth AmericaNorth MacedoniaNorthern AfricaNorwayOceaniaPakistanPanamaPeruPhilippinesPolandPortugalRomaniaRussiaSaudi ArabiaScotlandSenegalSerbiaSierra LeoneSingaporeSomaliaSouth AfricaSouth AmericaSouth Central AsiaSouth Eastern AsiaSouthern EuropeSpainSri LankaSt. Vincent and the GrenadinesSudanSwedenSwitzerlandSyriaTaiwanThailandTrinidad and TobagoTurkeyUgandaUkraineUruguayUzbekistanVenezuelaVietnamWest IndiesWestern AfricaWestern AsiaWestern EuropeYemenZaireZimbabweAzores
Immigrants from Northern Europe
Race
Ancestry
AfghanAfricanAlaska NativeAlaskan AthabascanAlbanianAleutAlsatianAmericanApacheArabArapahoArgentineanArmenianAssyrian/Chaldean/SyriacAustralianAustrianBahamianBangladeshiBarbadianBasqueBelgianBelizeanBermudanBhutaneseBlackfeetBolivianBrazilianBritishBritish West IndianBulgarianBurmeseCajunCambodianCanadianCape VerdeanCarpatho RusynCelticCentral AmericanCentral American IndianCherokeeCheyenneChickasawChileanChineseChippewaChoctawColombianColvilleComancheCosta RicanCreeCreekCroatianCrowCubanCypriotCzechCzechoslovakianDanishDelawareDominicanDutchDutch West IndianEastern EuropeanEcuadorianEgyptianEnglishEstonianEthiopianEuropeanFijianFilipinoFinnishFrenchFrench American IndianFrench CanadianGermanGerman RussianGhanaianGreekGuamanian/ChamorroGuatemalanGuyaneseHaitianHmongHonduranHopiHoumaHungarianIcelanderIndian (Asian)IndonesianInupiatIranianIraqiIrishIroquoisIsraeliItalianJamaicanJapaneseJordanianKenyanKiowaKoreanLaotianLatvianLebaneseLiberianLithuanianLumbeeLuxembourgerMacedonianMalaysianMalteseMarshalleseMenomineeMexicanMexican American IndianMongolianMoroccanNative HawaiianNavajoNepaleseNew ZealanderNicaraguanNigerianNorthern EuropeanNorwegianOkinawanOsageOttawaPaiutePakistaniPalestinianPanamanianParaguayanPennsylvania GermanPeruvianPimaPolishPortuguesePotawatomiPuebloPuerto RicanPuget Sound SalishRomanianRussianSalvadoranSamoanScandinavianScotch-IrishScottishSeminoleSenegaleseSerbianShoshoneSierra LeoneanSiouxSlavicSlovakSloveneSomaliSouth AfricanSouth AmericanSouth American IndianSoviet UnionSpaniardSpanishSpanish AmericanSpanish American IndianSri LankanSubsaharan AfricanSudaneseSwedishSwissSyrianTaiwaneseThaiTlingit-HaidaTohono O'OdhamTonganTrinidadian and TobagonianTsimshianTurkishU.S. Virgin IslanderUgandanUkrainianUruguayanUteVenezuelanVietnameseWelshWest IndianYakamaYaquiYugoslavianYumanYup'ikZimbabwean
Immigration
NonimmigrantsImmigrantsAfghanistanAfricaAlbaniaArgentinaArmeniaAsiaAustraliaAustriaBahamasBangladeshBarbadosBelarusBelgiumBelizeBoliviaBosnia and HerzegovinaBrazilBulgariaBurma/MyanmarCabo VerdeCambodiaCameroonCanadaCaribbeanCentral AmericaChileChinaColombiaCongoCosta RicaCroatiaCubaCzechoslovakiaDenmarkDominicaDominican RepublicEastern AfricaEastern AsiaEastern EuropeEcuadorEgyptEl SalvadorEnglandEritreaEthiopiaEuropeFijiFranceGermanyGhanaGreeceGrenadaGuatemalaGuyanaHaitiHondurasHong KongHungaryIndiaIndonesiaIranIraqIrelandItalyJamaicaJapanJordanKazakhstanKenyaKoreaKuwaitLaosLatin AmericaLatviaLebanonLiberiaLithuaniaMalaysiaMexicoMicronesiaMiddle AfricaMoldovaMoroccoNepalNetherlandsNicaraguaNigeriaNorth AmericaNorth MacedoniaNorthern AfricaNorthern EuropeNorwayOceaniaPakistanPanamaPeruPhilippinesPolandPortugalRomaniaRussiaSaudi ArabiaScotlandSenegalSerbiaSierra LeoneSingaporeSomaliaSouth AfricaSouth AmericaSouth Central AsiaSouth Eastern AsiaSouthern EuropeSpainSri LankaSt. Vincent and the GrenadinesSudanSwedenSwitzerlandSyriaTaiwanThailandTrinidad and TobagoTurkeyUgandaUkraineUruguayUzbekistanVenezuelaVietnamWest IndiesWestern AfricaWestern AsiaWestern EuropeYemenZaireZimbabweAzores
Married-couple Households
Income
Poverty
Unemployment
Labor Participation
Family Structure
Vehicle Availability
Education Level
Disability

Married-couple Households Comparison

Immigrants from Israel

Immigrants from Northern Europe

Exceptional
Exceptional
48.0%
MARRIED-COUPLE HOUSEHOLDS
97.4/ 100
METRIC RATING
85th/ 347
METRIC RANK
48.6%
MARRIED-COUPLE HOUSEHOLDS
99.3/ 100
METRIC RATING
56th/ 347
METRIC RANK

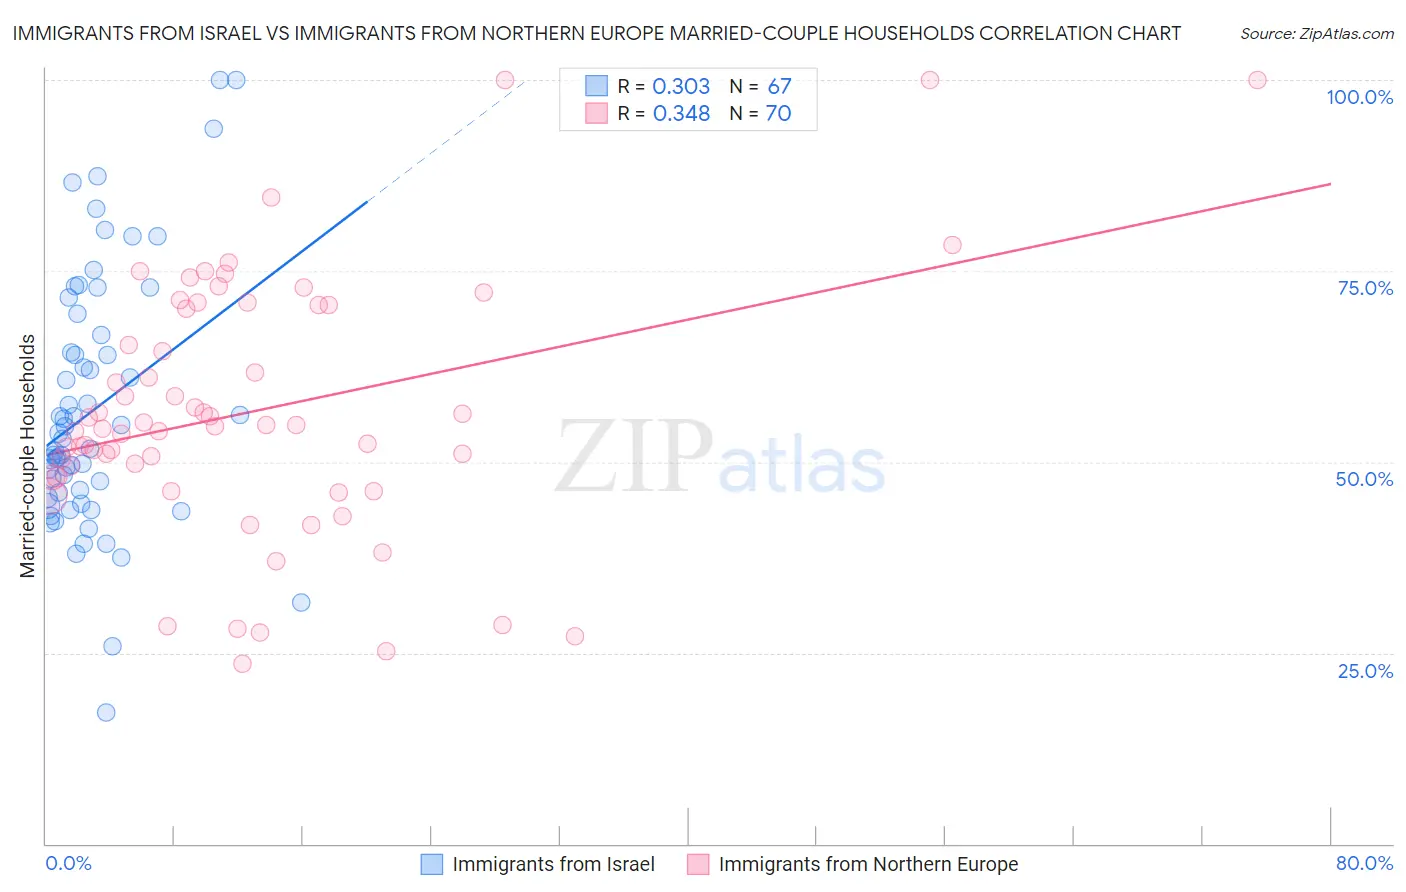
Immigrants from Israel vs Immigrants from Northern Europe Married-couple Households Correlation Chart

The statistical analysis conducted on geographies consisting of 209,978,634 people shows a mild positive correlation between the proportion of Immigrants from Israel and percentage of married-couple family households in the United States with a correlation coefficient (R) of 0.303 and weighted average of 48.0%. Similarly, the statistical analysis conducted on geographies consisting of 476,937,950 people shows a mild positive correlation between the proportion of Immigrants from Northern Europe and percentage of married-couple family households in the United States with a correlation coefficient (R) of 0.348 and weighted average of 48.6%, a difference of 1.2%.
Immigrants from Israel vs Immigrants from Northern Europe Married-couple Households

Married-couple Households Correlation Summary

MeasurementImmigrants from IsraelImmigrants from Northern Europe
Minimum17.2%23.5%
Maximum100.0%100.0%
Range82.8%76.5%
Mean56.9%56.7%
Median53.0%54.7%
Interquartile 25% (IQ1)45.4%48.0%
Interquartile 75% (IQ3)66.7%70.5%
Interquartile Range (IQR)21.3%22.5%
Standard Deviation (Sample)16.8%16.7%
Standard Deviation (Population)16.7%16.6%

Similar Demographics by Married-couple Households

Demographics Similar to Immigrants from Israel by Married-couple Households

In terms of married-couple households, the demographic groups most similar to Immigrants from Israel are Belgian (48.0%, a difference of 0.030%), Immigrants from Ireland (48.0%, a difference of 0.040%), Afghan (48.0%, a difference of 0.040%), Ukrainian (48.1%, a difference of 0.050%), and Guamanian/Chamorro (48.1%, a difference of 0.070%).
DemographicsRating | RankMarried-couple Households
Egyptians
98.2
/100
|
#78
Exceptional
48.2%
Immigrants | Netherlands
98.2
/100
|
#79
Exceptional
48.2%
Russians
98.1
/100
|
#80
Exceptional
48.2%
Finns
98.0
/100
|
#81
Exceptional
48.1%
Immigrants | Poland
97.7
/100
|
#82
Exceptional
48.1%
Guamanians/Chamorros
97.6
/100
|
#83
Exceptional
48.1%
Ukrainians
97.6
/100
|
#84
Exceptional
48.1%
Immigrants | Israel
97.4
/100
|
#85
Exceptional
48.0%
Belgians
97.4
/100
|
#86
Exceptional
48.0%
Immigrants | Ireland
97.3
/100
|
#87
Exceptional
48.0%
Afghans
97.3
/100
|
#88
Exceptional
48.0%
Cypriots
97.2
/100
|
#89
Exceptional
48.0%
French
97.2
/100
|
#90
Exceptional
48.0%
Immigrants | Moldova
97.0
/100
|
#91
Exceptional
48.0%
Palestinians
96.9
/100
|
#92
Exceptional
48.0%

Demographics Similar to Immigrants from Northern Europe by Married-couple Households

In terms of married-couple households, the demographic groups most similar to Immigrants from Northern Europe are Austrian (48.6%, a difference of 0.0%), White/Caucasian (48.6%, a difference of 0.010%), Immigrants from Lithuania (48.6%, a difference of 0.010%), Irish (48.6%, a difference of 0.070%), and Polish (48.5%, a difference of 0.090%).
DemographicsRating | RankMarried-couple Households
Immigrants | Sri Lanka
99.4
/100
|
#49
Exceptional
48.7%
Samoans
99.4
/100
|
#50
Exceptional
48.7%
Eastern Europeans
99.3
/100
|
#51
Exceptional
48.6%
Irish
99.3
/100
|
#52
Exceptional
48.6%
Whites/Caucasians
99.3
/100
|
#53
Exceptional
48.6%
Immigrants | Lithuania
99.3
/100
|
#54
Exceptional
48.6%
Austrians
99.3
/100
|
#55
Exceptional
48.6%
Immigrants | Northern Europe
99.3
/100
|
#56
Exceptional
48.6%
Poles
99.2
/100
|
#57
Exceptional
48.5%
Immigrants | Indonesia
99.2
/100
|
#58
Exceptional
48.5%
Czechoslovakians
99.2
/100
|
#59
Exceptional
48.5%
Croatians
99.1
/100
|
#60
Exceptional
48.5%
Bulgarians
99.1
/100
|
#61
Exceptional
48.5%
Luxembourgers
99.1
/100
|
#62
Exceptional
48.5%
Basques
99.0
/100
|
#63
Exceptional
48.4%