Immigrants from Israel vs Spanish American Married-couple Households

COMPARE

Immigrants from Israel
Race
Ancestry
AfghanAfricanAlaska NativeAlaskan AthabascanAlbanianAleutAlsatianAmericanApacheArabArapahoArgentineanArmenianAssyrian/Chaldean/SyriacAustralianAustrianBahamianBangladeshiBarbadianBasqueBelgianBelizeanBermudanBhutaneseBlackfeetBolivianBrazilianBritishBritish West IndianBulgarianBurmeseCajunCambodianCanadianCape VerdeanCarpatho RusynCelticCentral AmericanCentral American IndianCherokeeCheyenneChickasawChileanChineseChippewaChoctawColombianColvilleComancheCosta RicanCreeCreekCroatianCrowCubanCypriotCzechCzechoslovakianDanishDelawareDominicanDutchDutch West IndianEastern EuropeanEcuadorianEgyptianEnglishEstonianEthiopianEuropeanFijianFilipinoFinnishFrenchFrench American IndianFrench CanadianGermanGerman RussianGhanaianGreekGuamanian/ChamorroGuatemalanGuyaneseHaitianHmongHonduranHopiHoumaHungarianIcelanderIndian (Asian)IndonesianInupiatIranianIraqiIrishIroquoisIsraeliItalianJamaicanJapaneseJordanianKenyanKiowaKoreanLaotianLatvianLebaneseLiberianLithuanianLumbeeLuxembourgerMacedonianMalaysianMalteseMarshalleseMenomineeMexicanMexican American IndianMongolianMoroccanNative HawaiianNavajoNepaleseNew ZealanderNicaraguanNigerianNorthern EuropeanNorwegianOkinawanOsageOttawaPaiutePakistaniPalestinianPanamanianParaguayanPennsylvania GermanPeruvianPimaPolishPortuguesePotawatomiPuebloPuerto RicanPuget Sound SalishRomanianRussianSalvadoranSamoanScandinavianScotch-IrishScottishSeminoleSenegaleseSerbianShoshoneSierra LeoneanSiouxSlavicSlovakSloveneSomaliSouth AfricanSouth AmericanSouth American IndianSoviet UnionSpaniardSpanishSpanish American IndianSri LankanSubsaharan AfricanSudaneseSwedishSwissSyrianTaiwaneseThaiTlingit-HaidaTohono O'OdhamTonganTrinidadian and TobagonianTsimshianTurkishU.S. Virgin IslanderUgandanUkrainianUruguayanUteVenezuelanVietnameseWelshWest IndianYakamaYaquiYugoslavianYumanYup'ikZimbabwean
Immigration
NonimmigrantsImmigrantsAfghanistanAfricaAlbaniaArgentinaArmeniaAsiaAustraliaAustriaBahamasBangladeshBarbadosBelarusBelgiumBelizeBoliviaBosnia and HerzegovinaBrazilBulgariaBurma/MyanmarCabo VerdeCambodiaCameroonCanadaCaribbeanCentral AmericaChileChinaColombiaCongoCosta RicaCroatiaCubaCzechoslovakiaDenmarkDominicaDominican RepublicEastern AfricaEastern AsiaEastern EuropeEcuadorEgyptEl SalvadorEnglandEritreaEthiopiaEuropeFijiFranceGermanyGhanaGreeceGrenadaGuatemalaGuyanaHaitiHondurasHong KongHungaryIndiaIndonesiaIranIraqIrelandIsraelItalyJamaicaJapanJordanKazakhstanKenyaKoreaKuwaitLaosLatin AmericaLatviaLebanonLiberiaLithuaniaMalaysiaMexicoMicronesiaMiddle AfricaMoldovaMoroccoNepalNetherlandsNicaraguaNigeriaNorth AmericaNorth MacedoniaNorthern AfricaNorthern EuropeNorwayOceaniaPakistanPanamaPeruPhilippinesPolandPortugalRomaniaRussiaSaudi ArabiaScotlandSenegalSerbiaSierra LeoneSingaporeSomaliaSouth AfricaSouth AmericaSouth Central AsiaSouth Eastern AsiaSouthern EuropeSpainSri LankaSt. Vincent and the GrenadinesSudanSwedenSwitzerlandSyriaTaiwanThailandTrinidad and TobagoTurkeyUgandaUkraineUruguayUzbekistanVenezuelaVietnamWest IndiesWestern AfricaWestern AsiaWestern EuropeYemenZaireZimbabweAzores
Spanish American
Race
Ancestry
AfghanAfricanAlaska NativeAlaskan AthabascanAlbanianAleutAlsatianAmericanApacheArabArapahoArgentineanArmenianAssyrian/Chaldean/SyriacAustralianAustrianBahamianBangladeshiBarbadianBasqueBelgianBelizeanBermudanBhutaneseBlackfeetBolivianBrazilianBritishBritish West IndianBulgarianBurmeseCajunCambodianCanadianCape VerdeanCarpatho RusynCelticCentral AmericanCentral American IndianCherokeeCheyenneChickasawChileanChineseChippewaChoctawColombianColvilleComancheCosta RicanCreeCreekCroatianCrowCubanCypriotCzechCzechoslovakianDanishDelawareDominicanDutchDutch West IndianEastern EuropeanEcuadorianEgyptianEnglishEstonianEthiopianEuropeanFijianFilipinoFinnishFrenchFrench American IndianFrench CanadianGermanGerman RussianGhanaianGreekGuamanian/ChamorroGuatemalanGuyaneseHaitianHmongHonduranHopiHoumaHungarianIcelanderIndian (Asian)IndonesianInupiatIranianIraqiIrishIroquoisIsraeliItalianJamaicanJapaneseJordanianKenyanKiowaKoreanLaotianLatvianLebaneseLiberianLithuanianLumbeeLuxembourgerMacedonianMalaysianMalteseMarshalleseMenomineeMexicanMexican American IndianMongolianMoroccanNative HawaiianNavajoNepaleseNew ZealanderNicaraguanNigerianNorthern EuropeanNorwegianOkinawanOsageOttawaPaiutePakistaniPalestinianPanamanianParaguayanPennsylvania GermanPeruvianPimaPolishPortuguesePotawatomiPuebloPuerto RicanPuget Sound SalishRomanianRussianSalvadoranSamoanScandinavianScotch-IrishScottishSeminoleSenegaleseSerbianShoshoneSierra LeoneanSiouxSlavicSlovakSloveneSomaliSouth AfricanSouth AmericanSouth American IndianSoviet UnionSpaniardSpanishSpanish AmericanSpanish American IndianSri LankanSubsaharan AfricanSudaneseSwedishSwissSyrianTaiwaneseThaiTlingit-HaidaTohono O'OdhamTonganTrinidadian and TobagonianTsimshianTurkishU.S. Virgin IslanderUgandanUkrainianUruguayanUteVenezuelanVietnameseWelshWest IndianYakamaYaquiYugoslavianYumanYup'ikZimbabwean
Immigration
NonimmigrantsImmigrantsAfghanistanAfricaAlbaniaArgentinaArmeniaAsiaAustraliaAustriaBahamasBangladeshBarbadosBelarusBelgiumBelizeBoliviaBosnia and HerzegovinaBrazilBulgariaBurma/MyanmarCabo VerdeCambodiaCameroonCanadaCaribbeanCentral AmericaChileChinaColombiaCongoCosta RicaCroatiaCubaCzechoslovakiaDenmarkDominicaDominican RepublicEastern AfricaEastern AsiaEastern EuropeEcuadorEgyptEl SalvadorEnglandEritreaEthiopiaEuropeFijiFranceGermanyGhanaGreeceGrenadaGuatemalaGuyanaHaitiHondurasHong KongHungaryIndiaIndonesiaIranIraqIrelandItalyJamaicaJapanJordanKazakhstanKenyaKoreaKuwaitLaosLatin AmericaLatviaLebanonLiberiaLithuaniaMalaysiaMexicoMicronesiaMiddle AfricaMoldovaMoroccoNepalNetherlandsNicaraguaNigeriaNorth AmericaNorth MacedoniaNorthern AfricaNorthern EuropeNorwayOceaniaPakistanPanamaPeruPhilippinesPolandPortugalRomaniaRussiaSaudi ArabiaScotlandSenegalSerbiaSierra LeoneSingaporeSomaliaSouth AfricaSouth AmericaSouth Central AsiaSouth Eastern AsiaSouthern EuropeSpainSri LankaSt. Vincent and the GrenadinesSudanSwedenSwitzerlandSyriaTaiwanThailandTrinidad and TobagoTurkeyUgandaUkraineUruguayUzbekistanVenezuelaVietnamWest IndiesWestern AfricaWestern AsiaWestern EuropeYemenZaireZimbabweAzores
Married-couple Households
Income
Poverty
Unemployment
Labor Participation
Family Structure
Vehicle Availability
Education Level
Disability

Married-couple Households Comparison

Immigrants from Israel

Spanish Americans

Exceptional
Tragic
48.0%
MARRIED-COUPLE HOUSEHOLDS
97.4/ 100
METRIC RATING
85th/ 347
METRIC RANK
44.5%
MARRIED-COUPLE HOUSEHOLDS
1.1/ 100
METRIC RATING
239th/ 347
METRIC RANK

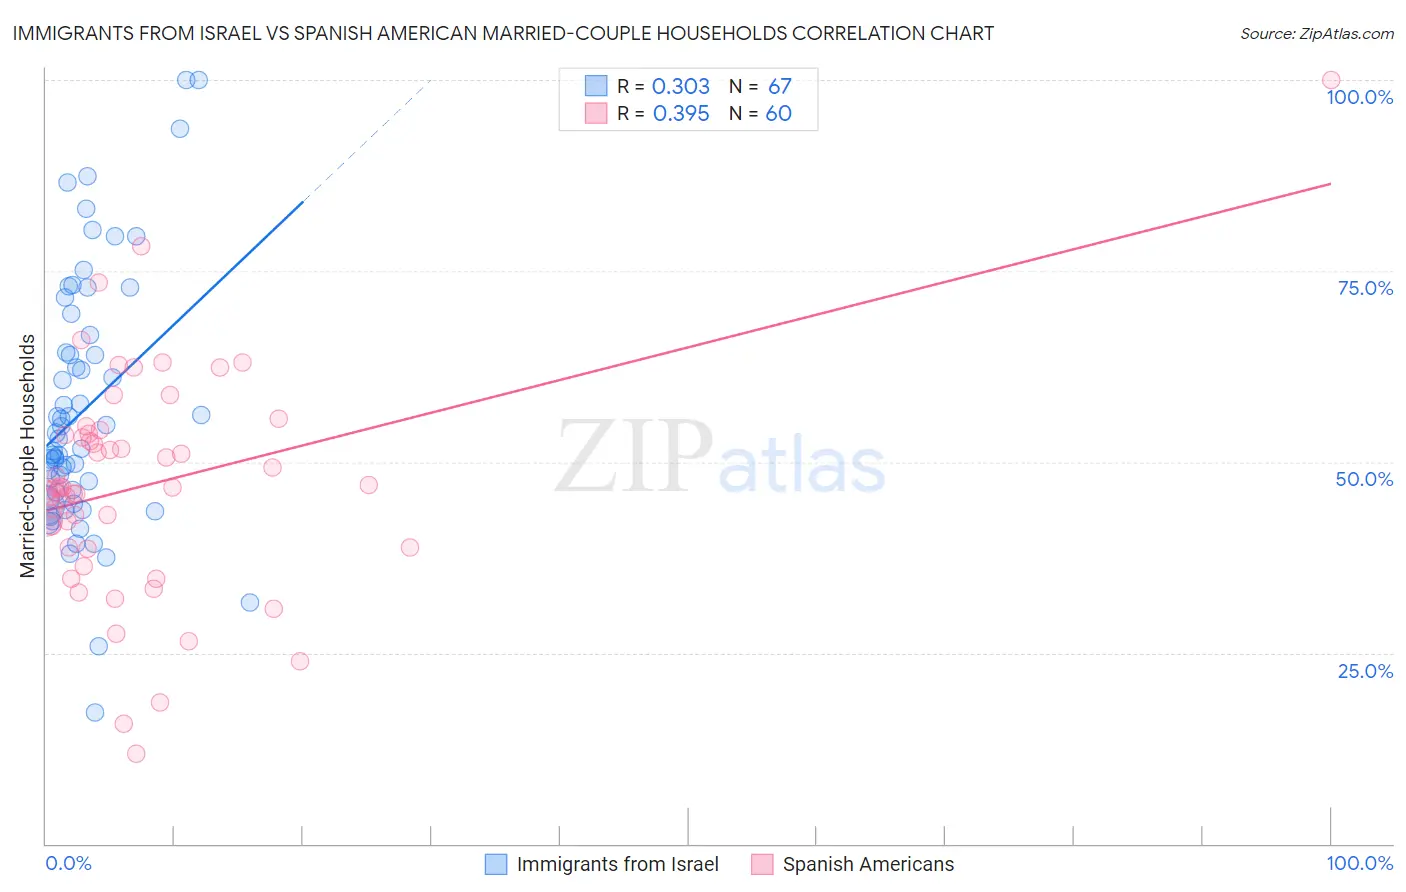
Immigrants from Israel vs Spanish American Married-couple Households Correlation Chart

The statistical analysis conducted on geographies consisting of 209,978,634 people shows a mild positive correlation between the proportion of Immigrants from Israel and percentage of married-couple family households in the United States with a correlation coefficient (R) of 0.303 and weighted average of 48.0%. Similarly, the statistical analysis conducted on geographies consisting of 103,168,336 people shows a mild positive correlation between the proportion of Spanish Americans and percentage of married-couple family households in the United States with a correlation coefficient (R) of 0.395 and weighted average of 44.5%, a difference of 8.0%.
Immigrants from Israel vs Spanish American Married-couple Households

Married-couple Households Correlation Summary

MeasurementImmigrants from IsraelSpanish American
Minimum17.2%11.8%
Maximum100.0%100.0%
Range82.8%88.2%
Mean56.9%46.9%
Median53.0%46.6%
Interquartile 25% (IQ1)45.4%38.8%
Interquartile 75% (IQ3)66.7%53.6%
Interquartile Range (IQR)21.3%14.9%
Standard Deviation (Sample)16.8%14.7%
Standard Deviation (Population)16.7%14.6%

Similar Demographics by Married-couple Households

Demographics Similar to Immigrants from Israel by Married-couple Households

In terms of married-couple households, the demographic groups most similar to Immigrants from Israel are Belgian (48.0%, a difference of 0.030%), Immigrants from Ireland (48.0%, a difference of 0.040%), Afghan (48.0%, a difference of 0.040%), Ukrainian (48.1%, a difference of 0.050%), and Guamanian/Chamorro (48.1%, a difference of 0.070%).
DemographicsRating | RankMarried-couple Households
Egyptians
98.2
/100
|
#78
Exceptional
48.2%
Immigrants | Netherlands
98.2
/100
|
#79
Exceptional
48.2%
Russians
98.1
/100
|
#80
Exceptional
48.2%
Finns
98.0
/100
|
#81
Exceptional
48.1%
Immigrants | Poland
97.7
/100
|
#82
Exceptional
48.1%
Guamanians/Chamorros
97.6
/100
|
#83
Exceptional
48.1%
Ukrainians
97.6
/100
|
#84
Exceptional
48.1%
Immigrants | Israel
97.4
/100
|
#85
Exceptional
48.0%
Belgians
97.4
/100
|
#86
Exceptional
48.0%
Immigrants | Ireland
97.3
/100
|
#87
Exceptional
48.0%
Afghans
97.3
/100
|
#88
Exceptional
48.0%
Cypriots
97.2
/100
|
#89
Exceptional
48.0%
French
97.2
/100
|
#90
Exceptional
48.0%
Immigrants | Moldova
97.0
/100
|
#91
Exceptional
48.0%
Palestinians
96.9
/100
|
#92
Exceptional
48.0%

Demographics Similar to Spanish Americans by Married-couple Households

In terms of married-couple households, the demographic groups most similar to Spanish Americans are Immigrants from Uruguay (44.5%, a difference of 0.020%), Comanche (44.5%, a difference of 0.070%), Ute (44.4%, a difference of 0.080%), Immigrants from Bosnia and Herzegovina (44.4%, a difference of 0.080%), and Immigrants from Nicaragua (44.5%, a difference of 0.10%).
DemographicsRating | RankMarried-couple Households
Marshallese
1.5
/100
|
#232
Tragic
44.6%
Immigrants | Uganda
1.5
/100
|
#233
Tragic
44.6%
Immigrants | Panama
1.3
/100
|
#234
Tragic
44.6%
Immigrants | Nicaragua
1.2
/100
|
#235
Tragic
44.5%
Yaqui
1.2
/100
|
#236
Tragic
44.5%
Comanche
1.2
/100
|
#237
Tragic
44.5%
Immigrants | Uruguay
1.1
/100
|
#238
Tragic
44.5%
Spanish Americans
1.1
/100
|
#239
Tragic
44.5%
Ute
1.0
/100
|
#240
Tragic
44.4%
Immigrants | Bosnia and Herzegovina
1.0
/100
|
#241
Tragic
44.4%
Immigrants | Albania
1.0
/100
|
#242
Tragic
44.4%
Immigrants | Saudi Arabia
0.9
/100
|
#243
Tragic
44.4%
Immigrants | Armenia
0.7
/100
|
#244
Tragic
44.3%
Immigrants | El Salvador
0.7
/100
|
#245
Tragic
44.3%
Immigrants | Cuba
0.6
/100
|
#246
Tragic
44.2%