Immigrants from Israel vs European Married-couple Households

COMPARE

Immigrants from Israel
Race
Ancestry
AfghanAfricanAlaska NativeAlaskan AthabascanAlbanianAleutAlsatianAmericanApacheArabArapahoArgentineanArmenianAssyrian/Chaldean/SyriacAustralianAustrianBahamianBangladeshiBarbadianBasqueBelgianBelizeanBermudanBhutaneseBlackfeetBolivianBrazilianBritishBritish West IndianBulgarianBurmeseCajunCambodianCanadianCape VerdeanCarpatho RusynCelticCentral AmericanCentral American IndianCherokeeCheyenneChickasawChileanChineseChippewaChoctawColombianColvilleComancheCosta RicanCreeCreekCroatianCrowCubanCypriotCzechCzechoslovakianDanishDelawareDominicanDutchDutch West IndianEastern EuropeanEcuadorianEgyptianEnglishEstonianEthiopianFijianFilipinoFinnishFrenchFrench American IndianFrench CanadianGermanGerman RussianGhanaianGreekGuamanian/ChamorroGuatemalanGuyaneseHaitianHmongHonduranHopiHoumaHungarianIcelanderIndian (Asian)IndonesianInupiatIranianIraqiIrishIroquoisIsraeliItalianJamaicanJapaneseJordanianKenyanKiowaKoreanLaotianLatvianLebaneseLiberianLithuanianLumbeeLuxembourgerMacedonianMalaysianMalteseMarshalleseMenomineeMexicanMexican American IndianMongolianMoroccanNative HawaiianNavajoNepaleseNew ZealanderNicaraguanNigerianNorthern EuropeanNorwegianOkinawanOsageOttawaPaiutePakistaniPalestinianPanamanianParaguayanPennsylvania GermanPeruvianPimaPolishPortuguesePotawatomiPuebloPuerto RicanPuget Sound SalishRomanianRussianSalvadoranSamoanScandinavianScotch-IrishScottishSeminoleSenegaleseSerbianShoshoneSierra LeoneanSiouxSlavicSlovakSloveneSomaliSouth AfricanSouth AmericanSouth American IndianSoviet UnionSpaniardSpanishSpanish AmericanSpanish American IndianSri LankanSubsaharan AfricanSudaneseSwedishSwissSyrianTaiwaneseThaiTlingit-HaidaTohono O'OdhamTonganTrinidadian and TobagonianTsimshianTurkishU.S. Virgin IslanderUgandanUkrainianUruguayanUteVenezuelanVietnameseWelshWest IndianYakamaYaquiYugoslavianYumanYup'ikZimbabwean
Immigration
NonimmigrantsImmigrantsAfghanistanAfricaAlbaniaArgentinaArmeniaAsiaAustraliaAustriaBahamasBangladeshBarbadosBelarusBelgiumBelizeBoliviaBosnia and HerzegovinaBrazilBulgariaBurma/MyanmarCabo VerdeCambodiaCameroonCanadaCaribbeanCentral AmericaChileChinaColombiaCongoCosta RicaCroatiaCubaCzechoslovakiaDenmarkDominicaDominican RepublicEastern AfricaEastern AsiaEastern EuropeEcuadorEgyptEl SalvadorEnglandEritreaEthiopiaEuropeFijiFranceGermanyGhanaGreeceGrenadaGuatemalaGuyanaHaitiHondurasHong KongHungaryIndiaIndonesiaIranIraqIrelandIsraelItalyJamaicaJapanJordanKazakhstanKenyaKoreaKuwaitLaosLatin AmericaLatviaLebanonLiberiaLithuaniaMalaysiaMexicoMicronesiaMiddle AfricaMoldovaMoroccoNepalNetherlandsNicaraguaNigeriaNorth AmericaNorth MacedoniaNorthern AfricaNorthern EuropeNorwayOceaniaPakistanPanamaPeruPhilippinesPolandPortugalRomaniaRussiaSaudi ArabiaScotlandSenegalSerbiaSierra LeoneSingaporeSomaliaSouth AfricaSouth AmericaSouth Central AsiaSouth Eastern AsiaSouthern EuropeSpainSri LankaSt. Vincent and the GrenadinesSudanSwedenSwitzerlandSyriaTaiwanThailandTrinidad and TobagoTurkeyUgandaUkraineUruguayUzbekistanVenezuelaVietnamWest IndiesWestern AfricaWestern AsiaWestern EuropeYemenZaireZimbabweAzores
European
Race
Ancestry
AfghanAfricanAlaska NativeAlaskan AthabascanAlbanianAleutAlsatianAmericanApacheArabArapahoArgentineanArmenianAssyrian/Chaldean/SyriacAustralianAustrianBahamianBangladeshiBarbadianBasqueBelgianBelizeanBermudanBhutaneseBlackfeetBolivianBrazilianBritishBritish West IndianBulgarianBurmeseCajunCambodianCanadianCape VerdeanCarpatho RusynCelticCentral AmericanCentral American IndianCherokeeCheyenneChickasawChileanChineseChippewaChoctawColombianColvilleComancheCosta RicanCreeCreekCroatianCrowCubanCypriotCzechCzechoslovakianDanishDelawareDominicanDutchDutch West IndianEastern EuropeanEcuadorianEgyptianEnglishEstonianEthiopianEuropeanFijianFilipinoFinnishFrenchFrench American IndianFrench CanadianGermanGerman RussianGhanaianGreekGuamanian/ChamorroGuatemalanGuyaneseHaitianHmongHonduranHopiHoumaHungarianIcelanderIndian (Asian)IndonesianInupiatIranianIraqiIrishIroquoisIsraeliItalianJamaicanJapaneseJordanianKenyanKiowaKoreanLaotianLatvianLebaneseLiberianLithuanianLumbeeLuxembourgerMacedonianMalaysianMalteseMarshalleseMenomineeMexicanMexican American IndianMongolianMoroccanNative HawaiianNavajoNepaleseNew ZealanderNicaraguanNigerianNorthern EuropeanNorwegianOkinawanOsageOttawaPaiutePakistaniPalestinianPanamanianParaguayanPennsylvania GermanPeruvianPimaPolishPortuguesePotawatomiPuebloPuerto RicanPuget Sound SalishRomanianRussianSalvadoranSamoanScandinavianScotch-IrishScottishSeminoleSenegaleseSerbianShoshoneSierra LeoneanSiouxSlavicSlovakSloveneSomaliSouth AfricanSouth AmericanSouth American IndianSoviet UnionSpaniardSpanishSpanish AmericanSpanish American IndianSri LankanSubsaharan AfricanSudaneseSwedishSwissSyrianTaiwaneseThaiTlingit-HaidaTohono O'OdhamTonganTrinidadian and TobagonianTsimshianTurkishU.S. Virgin IslanderUgandanUkrainianUruguayanUteVenezuelanVietnameseWelshWest IndianYakamaYaquiYugoslavianYumanYup'ikZimbabwean
Immigration
NonimmigrantsImmigrantsAfghanistanAfricaAlbaniaArgentinaArmeniaAsiaAustraliaAustriaBahamasBangladeshBarbadosBelarusBelgiumBelizeBoliviaBosnia and HerzegovinaBrazilBulgariaBurma/MyanmarCabo VerdeCambodiaCameroonCanadaCaribbeanCentral AmericaChileChinaColombiaCongoCosta RicaCroatiaCubaCzechoslovakiaDenmarkDominicaDominican RepublicEastern AfricaEastern AsiaEastern EuropeEcuadorEgyptEl SalvadorEnglandEritreaEthiopiaEuropeFijiFranceGermanyGhanaGreeceGrenadaGuatemalaGuyanaHaitiHondurasHong KongHungaryIndiaIndonesiaIranIraqIrelandItalyJamaicaJapanJordanKazakhstanKenyaKoreaKuwaitLaosLatin AmericaLatviaLebanonLiberiaLithuaniaMalaysiaMexicoMicronesiaMiddle AfricaMoldovaMoroccoNepalNetherlandsNicaraguaNigeriaNorth AmericaNorth MacedoniaNorthern AfricaNorthern EuropeNorwayOceaniaPakistanPanamaPeruPhilippinesPolandPortugalRomaniaRussiaSaudi ArabiaScotlandSenegalSerbiaSierra LeoneSingaporeSomaliaSouth AfricaSouth AmericaSouth Central AsiaSouth Eastern AsiaSouthern EuropeSpainSri LankaSt. Vincent and the GrenadinesSudanSwedenSwitzerlandSyriaTaiwanThailandTrinidad and TobagoTurkeyUgandaUkraineUruguayUzbekistanVenezuelaVietnamWest IndiesWestern AfricaWestern AsiaWestern EuropeYemenZaireZimbabweAzores
Married-couple Households
Income
Poverty
Unemployment
Labor Participation
Family Structure
Vehicle Availability
Education Level
Disability

Married-couple Households Comparison

Immigrants from Israel

Europeans

Exceptional
Exceptional
48.0%
MARRIED-COUPLE HOUSEHOLDS
97.4/ 100
METRIC RATING
85th/ 347
METRIC RANK
49.6%
MARRIED-COUPLE HOUSEHOLDS
99.9/ 100
METRIC RATING
19th/ 347
METRIC RANK

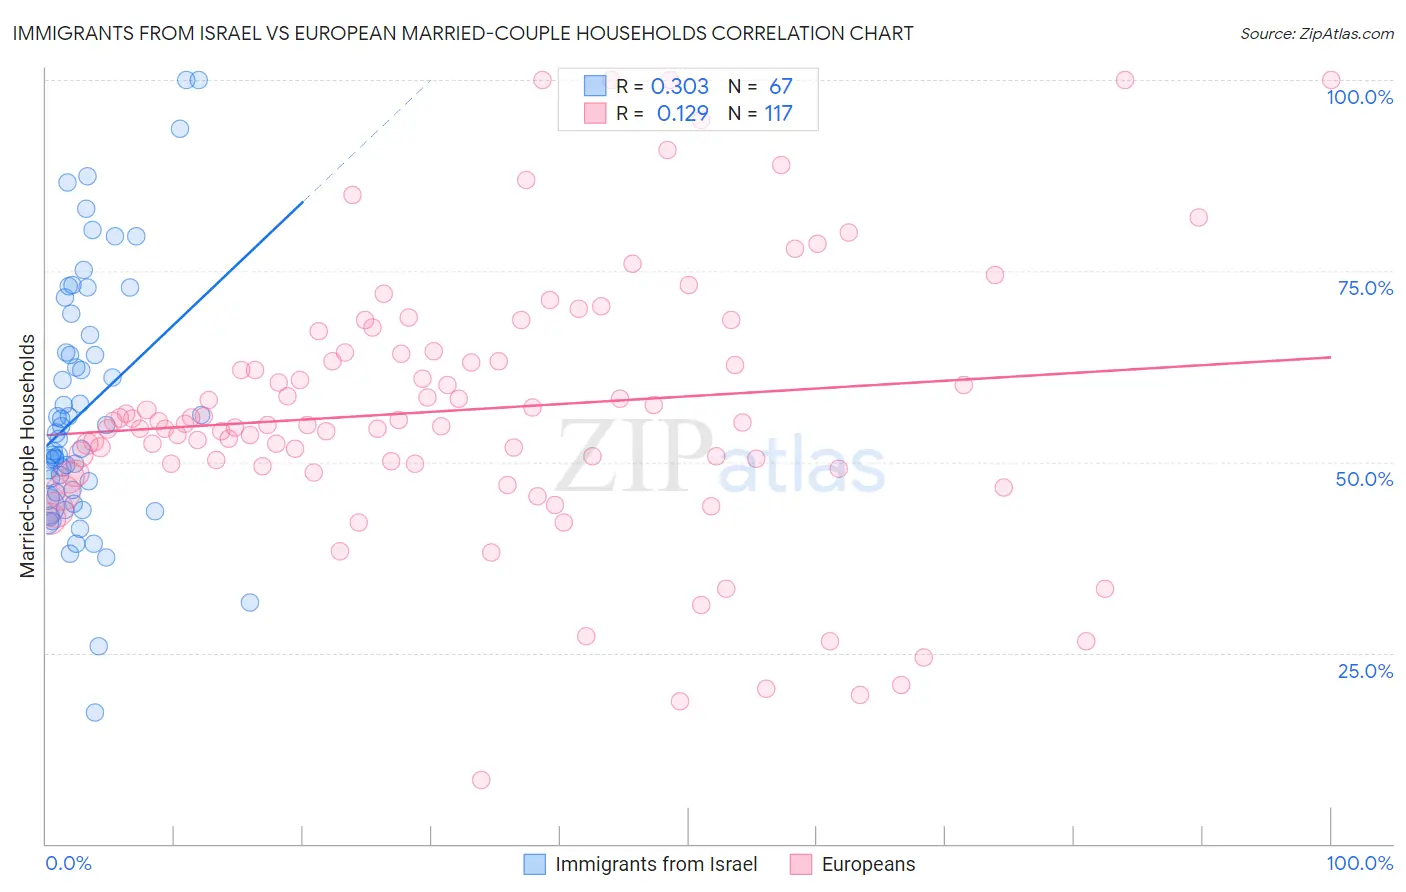
Immigrants from Israel vs European Married-couple Households Correlation Chart

The statistical analysis conducted on geographies consisting of 209,978,634 people shows a mild positive correlation between the proportion of Immigrants from Israel and percentage of married-couple family households in the United States with a correlation coefficient (R) of 0.303 and weighted average of 48.0%. Similarly, the statistical analysis conducted on geographies consisting of 561,207,916 people shows a poor positive correlation between the proportion of Europeans and percentage of married-couple family households in the United States with a correlation coefficient (R) of 0.129 and weighted average of 49.6%, a difference of 3.2%.
Immigrants from Israel vs European Married-couple Households

Married-couple Households Correlation Summary

MeasurementImmigrants from IsraelEuropean
Minimum17.2%8.3%
Maximum100.0%100.0%
Range82.8%91.7%
Mean56.9%56.8%
Median53.0%54.9%
Interquartile 25% (IQ1)45.4%49.6%
Interquartile 75% (IQ3)66.7%64.2%
Interquartile Range (IQR)21.3%14.6%
Standard Deviation (Sample)16.8%17.7%
Standard Deviation (Population)16.7%17.6%

Similar Demographics by Married-couple Households

Demographics Similar to Immigrants from Israel by Married-couple Households

In terms of married-couple households, the demographic groups most similar to Immigrants from Israel are Belgian (48.0%, a difference of 0.030%), Immigrants from Ireland (48.0%, a difference of 0.040%), Afghan (48.0%, a difference of 0.040%), Ukrainian (48.1%, a difference of 0.050%), and Guamanian/Chamorro (48.1%, a difference of 0.070%).
DemographicsRating | RankMarried-couple Households
Egyptians
98.2
/100
|
#78
Exceptional
48.2%
Immigrants | Netherlands
98.2
/100
|
#79
Exceptional
48.2%
Russians
98.1
/100
|
#80
Exceptional
48.2%
Finns
98.0
/100
|
#81
Exceptional
48.1%
Immigrants | Poland
97.7
/100
|
#82
Exceptional
48.1%
Guamanians/Chamorros
97.6
/100
|
#83
Exceptional
48.1%
Ukrainians
97.6
/100
|
#84
Exceptional
48.1%
Immigrants | Israel
97.4
/100
|
#85
Exceptional
48.0%
Belgians
97.4
/100
|
#86
Exceptional
48.0%
Immigrants | Ireland
97.3
/100
|
#87
Exceptional
48.0%
Afghans
97.3
/100
|
#88
Exceptional
48.0%
Cypriots
97.2
/100
|
#89
Exceptional
48.0%
French
97.2
/100
|
#90
Exceptional
48.0%
Immigrants | Moldova
97.0
/100
|
#91
Exceptional
48.0%
Palestinians
96.9
/100
|
#92
Exceptional
48.0%

Demographics Similar to Europeans by Married-couple Households

In terms of married-couple households, the demographic groups most similar to Europeans are Scandinavian (49.6%, a difference of 0.0%), Norwegian (49.5%, a difference of 0.060%), English (49.6%, a difference of 0.16%), Immigrants from Hong Kong (49.6%, a difference of 0.17%), and Asian (49.5%, a difference of 0.17%).
DemographicsRating | RankMarried-couple Households
Swiss
100.0
/100
|
#12
Exceptional
49.9%
Immigrants | Korea
100.0
/100
|
#13
Exceptional
49.9%
Burmese
100.0
/100
|
#14
Exceptional
49.8%
Koreans
99.9
/100
|
#15
Exceptional
49.7%
Swedes
99.9
/100
|
#16
Exceptional
49.7%
Immigrants | Hong Kong
99.9
/100
|
#17
Exceptional
49.6%
English
99.9
/100
|
#18
Exceptional
49.6%
Europeans
99.9
/100
|
#19
Exceptional
49.6%
Scandinavians
99.9
/100
|
#20
Exceptional
49.6%
Norwegians
99.9
/100
|
#21
Exceptional
49.5%
Asians
99.9
/100
|
#22
Exceptional
49.5%
Dutch
99.9
/100
|
#23
Exceptional
49.5%
Czechs
99.9
/100
|
#24
Exceptional
49.4%
Immigrants | Philippines
99.9
/100
|
#25
Exceptional
49.3%
Immigrants | Scotland
99.8
/100
|
#26
Exceptional
49.3%