Immigrants from Israel vs Immigrants from Northern Europe Median Female Earnings
COMPARE
Immigrants from Israel
Immigrants from Northern Europe
Median Female Earnings
Median Female Earnings Comparison
Immigrants from Israel
Immigrants from Northern Europe
$46,902
MEDIAN FEMALE EARNINGS
100.0/ 100
METRIC RATING
12th/ 347
METRIC RANK
$44,366
MEDIAN FEMALE EARNINGS
100.0/ 100
METRIC RATING
32nd/ 347
METRIC RANK
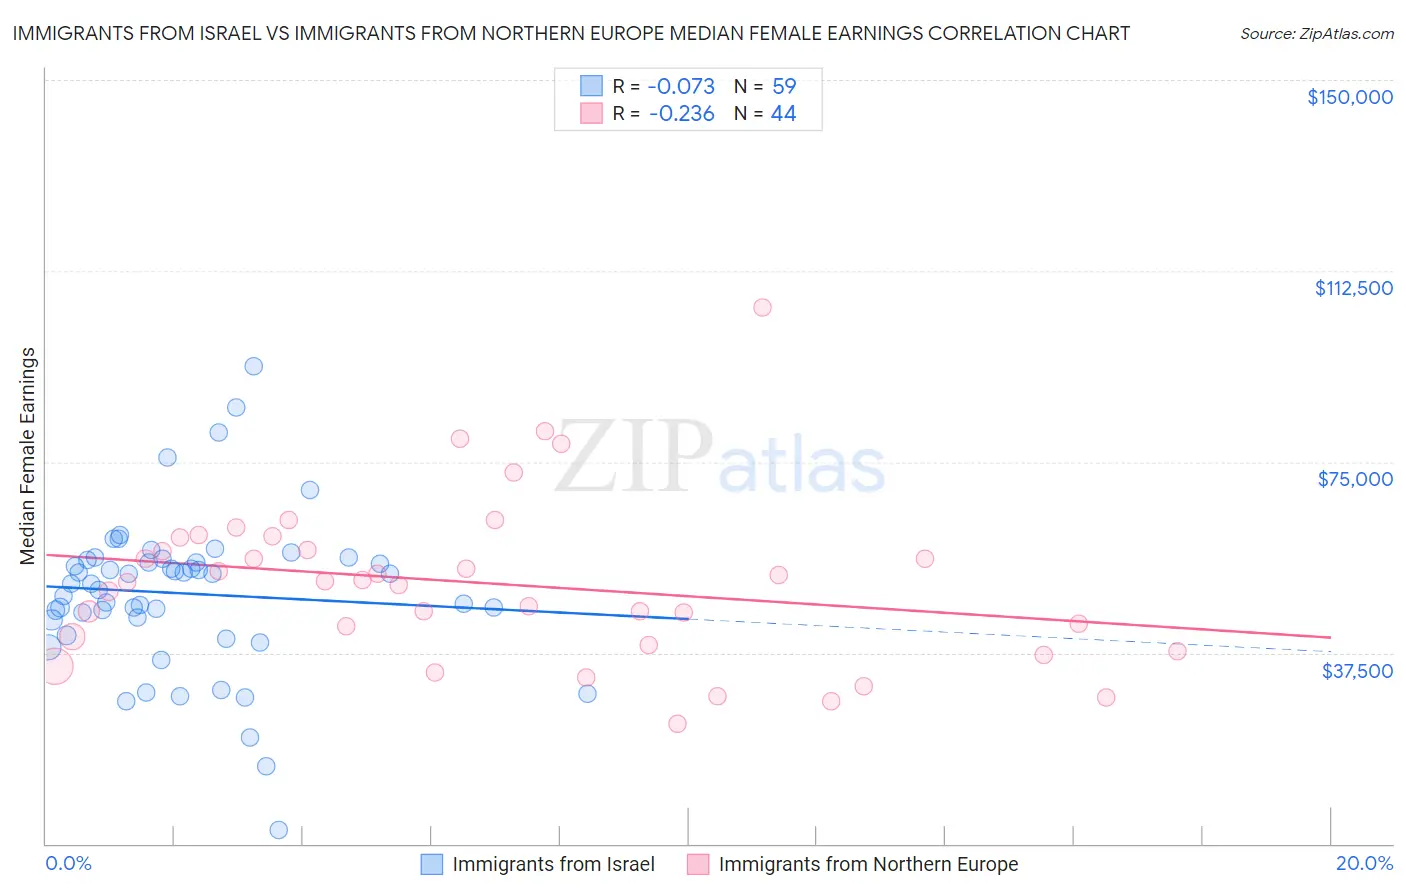
Immigrants from Israel vs Immigrants from Northern Europe Median Female Earnings Correlation Chart
The statistical analysis conducted on geographies consisting of 209,992,905 people shows a slight negative correlation between the proportion of Immigrants from Israel and median female earnings in the United States with a correlation coefficient (R) of -0.073 and weighted average of $46,902. Similarly, the statistical analysis conducted on geographies consisting of 476,746,043 people shows a weak negative correlation between the proportion of Immigrants from Northern Europe and median female earnings in the United States with a correlation coefficient (R) of -0.236 and weighted average of $44,366, a difference of 5.7%.
Median Female Earnings Correlation Summary
| Measurement | Immigrants from Israel | Immigrants from Northern Europe |
| Minimum | $2,606 | $23,685 |
| Maximum | $93,787 | $105,254 |
| Range | $91,181 | $81,569 |
| Mean | $49,152 | $51,135 |
| Median | $51,157 | $51,432 |
| Interquartile 25% (IQ1) | $44,051 | $39,901 |
| Interquartile 75% (IQ3) | $55,815 | $58,905 |
| Interquartile Range (IQR) | $11,764 | $19,004 |
| Standard Deviation (Sample) | $15,373 | $16,162 |
| Standard Deviation (Population) | $15,242 | $15,978 |
Demographics Similar to Immigrants from Israel and Immigrants from Northern Europe by Median Female Earnings
In terms of median female earnings, the demographic groups most similar to Immigrants from Israel are Immigrants from Australia ($46,573, a difference of 0.71%), Soviet Union ($46,556, a difference of 0.74%), Immigrants from Eastern Asia ($46,502, a difference of 0.86%), Indian (Asian) ($46,481, a difference of 0.91%), and Immigrants from South Central Asia ($46,324, a difference of 1.3%). Similarly, the demographic groups most similar to Immigrants from Northern Europe are Immigrants from France ($44,541, a difference of 0.40%), Immigrants from Belgium ($44,587, a difference of 0.50%), Asian ($44,586, a difference of 0.50%), Immigrants from Russia ($44,680, a difference of 0.71%), and Turkish ($44,695, a difference of 0.74%).
| Demographics | Rating | Rank | Median Female Earnings |
| Immigrants | Israel | 100.0 /100 | #12 | Exceptional $46,902 |
| Immigrants | Australia | 100.0 /100 | #13 | Exceptional $46,573 |
| Soviet Union | 100.0 /100 | #14 | Exceptional $46,556 |
| Immigrants | Eastern Asia | 100.0 /100 | #15 | Exceptional $46,502 |
| Indians (Asian) | 100.0 /100 | #16 | Exceptional $46,481 |
| Immigrants | South Central Asia | 100.0 /100 | #17 | Exceptional $46,324 |
| Cypriots | 100.0 /100 | #18 | Exceptional $45,570 |
| Eastern Europeans | 100.0 /100 | #19 | Exceptional $45,385 |
| Immigrants | Japan | 100.0 /100 | #20 | Exceptional $45,323 |
| Cambodians | 100.0 /100 | #21 | Exceptional $45,014 |
| Immigrants | Greece | 100.0 /100 | #22 | Exceptional $44,976 |
| Burmese | 100.0 /100 | #23 | Exceptional $44,911 |
| Immigrants | Korea | 100.0 /100 | #24 | Exceptional $44,847 |
| Immigrants | Sweden | 100.0 /100 | #25 | Exceptional $44,774 |
| Immigrants | Belarus | 100.0 /100 | #26 | Exceptional $44,757 |
| Turks | 100.0 /100 | #27 | Exceptional $44,695 |
| Immigrants | Russia | 100.0 /100 | #28 | Exceptional $44,680 |
| Immigrants | Belgium | 100.0 /100 | #29 | Exceptional $44,587 |
| Asians | 100.0 /100 | #30 | Exceptional $44,586 |
| Immigrants | France | 100.0 /100 | #31 | Exceptional $44,541 |
| Immigrants | Northern Europe | 100.0 /100 | #32 | Exceptional $44,366 |