Yakama vs Immigrants from Northern Europe Married-couple Households
COMPARE
Yakama
Immigrants from Northern Europe
Married-couple Households
Married-couple Households Comparison
Yakama
Immigrants from Northern Europe
45.2%
MARRIED-COUPLE HOUSEHOLDS
5.8/ 100
METRIC RATING
213th/ 347
METRIC RANK
48.6%
MARRIED-COUPLE HOUSEHOLDS
99.3/ 100
METRIC RATING
56th/ 347
METRIC RANK
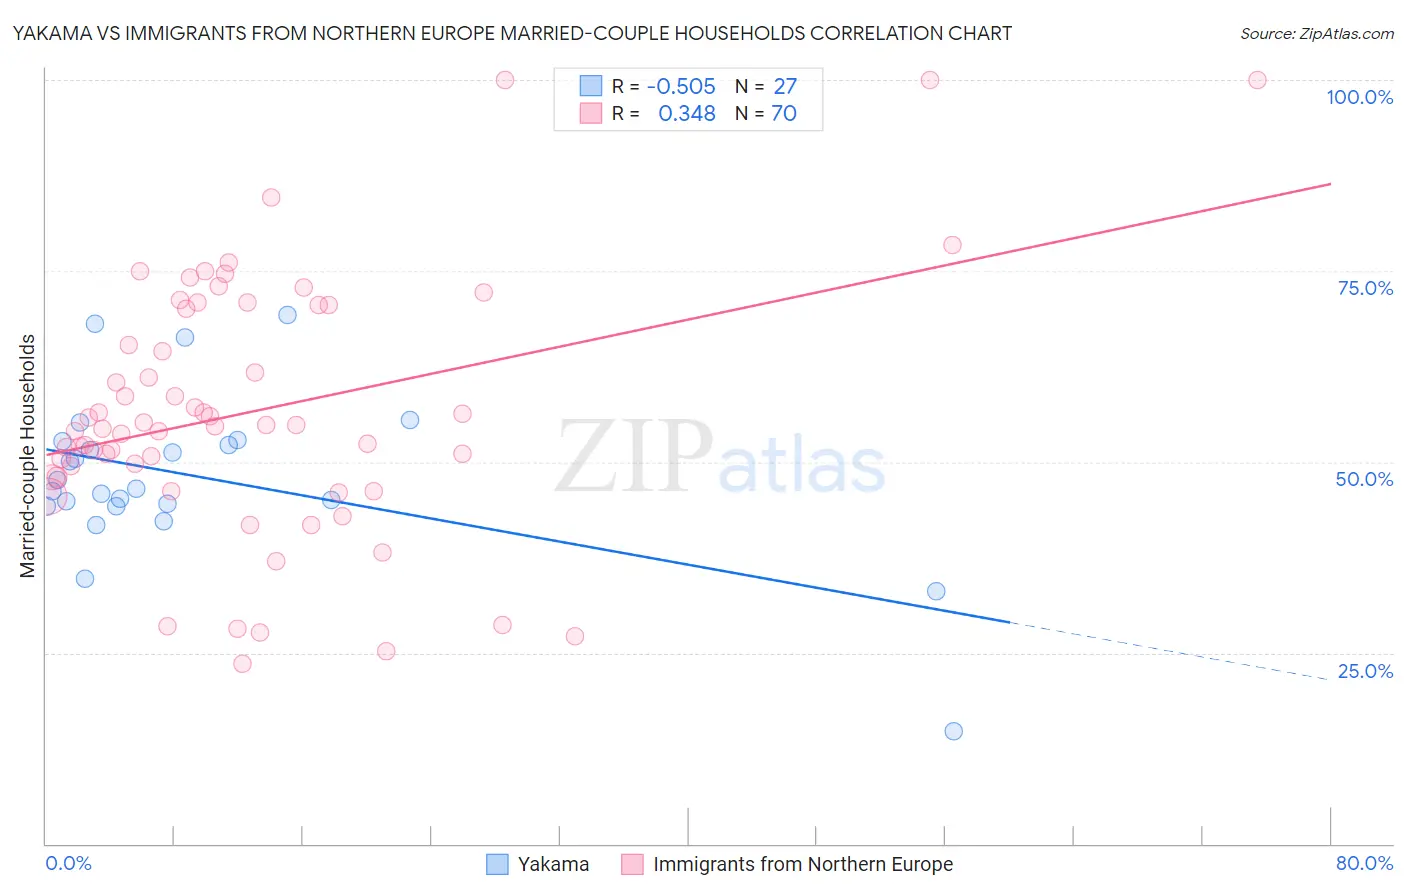
Yakama vs Immigrants from Northern Europe Married-couple Households Correlation Chart
The statistical analysis conducted on geographies consisting of 19,917,879 people shows a substantial negative correlation between the proportion of Yakama and percentage of married-couple family households in the United States with a correlation coefficient (R) of -0.505 and weighted average of 45.2%. Similarly, the statistical analysis conducted on geographies consisting of 476,937,950 people shows a mild positive correlation between the proportion of Immigrants from Northern Europe and percentage of married-couple family households in the United States with a correlation coefficient (R) of 0.348 and weighted average of 48.6%, a difference of 7.4%.
Married-couple Households Correlation Summary
| Measurement | Yakama | Immigrants from Northern Europe |
| Minimum | 14.7% | 23.5% |
| Maximum | 69.2% | 100.0% |
| Range | 54.6% | 76.5% |
| Mean | 48.0% | 56.7% |
| Median | 46.5% | 54.7% |
| Interquartile 25% (IQ1) | 44.3% | 48.0% |
| Interquartile 75% (IQ3) | 52.8% | 70.5% |
| Interquartile Range (IQR) | 8.5% | 22.5% |
| Standard Deviation (Sample) | 10.8% | 16.7% |
| Standard Deviation (Population) | 10.6% | 16.6% |
Similar Demographics by Married-couple Households
Demographics Similar to Yakama by Married-couple Households
In terms of married-couple households, the demographic groups most similar to Yakama are Japanese (45.2%, a difference of 0.020%), Immigrants from Nepal (45.2%, a difference of 0.040%), Immigrants from Portugal (45.2%, a difference of 0.050%), Panamanian (45.2%, a difference of 0.070%), and Immigrants from the Azores (45.2%, a difference of 0.090%).
| Demographics | Rating | Rank | Married-couple Households |
| Uruguayans | 10.4 /100 | #206 | Poor 45.5% |
| Immigrants | France | 8.8 /100 | #207 | Tragic 45.4% |
| Hispanics or Latinos | 8.7 /100 | #208 | Tragic 45.4% |
| Immigrants | Uzbekistan | 8.4 /100 | #209 | Tragic 45.4% |
| Cubans | 7.7 /100 | #210 | Tragic 45.4% |
| Immigrants | Spain | 7.3 /100 | #211 | Tragic 45.3% |
| Creek | 6.4 /100 | #212 | Tragic 45.3% |
| Yakama | 5.8 /100 | #213 | Tragic 45.2% |
| Japanese | 5.7 /100 | #214 | Tragic 45.2% |
| Immigrants | Nepal | 5.6 /100 | #215 | Tragic 45.2% |
| Immigrants | Portugal | 5.6 /100 | #216 | Tragic 45.2% |
| Panamanians | 5.5 /100 | #217 | Tragic 45.2% |
| Immigrants | Azores | 5.3 /100 | #218 | Tragic 45.2% |
| Nicaraguans | 5.3 /100 | #219 | Tragic 45.2% |
| Immigrants | Thailand | 5.1 /100 | #220 | Tragic 45.2% |
Demographics Similar to Immigrants from Northern Europe by Married-couple Households
In terms of married-couple households, the demographic groups most similar to Immigrants from Northern Europe are Austrian (48.6%, a difference of 0.0%), White/Caucasian (48.6%, a difference of 0.010%), Immigrants from Lithuania (48.6%, a difference of 0.010%), Irish (48.6%, a difference of 0.070%), and Polish (48.5%, a difference of 0.090%).
| Demographics | Rating | Rank | Married-couple Households |
| Immigrants | Sri Lanka | 99.4 /100 | #49 | Exceptional 48.7% |
| Samoans | 99.4 /100 | #50 | Exceptional 48.7% |
| Eastern Europeans | 99.3 /100 | #51 | Exceptional 48.6% |
| Irish | 99.3 /100 | #52 | Exceptional 48.6% |
| Whites/Caucasians | 99.3 /100 | #53 | Exceptional 48.6% |
| Immigrants | Lithuania | 99.3 /100 | #54 | Exceptional 48.6% |
| Austrians | 99.3 /100 | #55 | Exceptional 48.6% |
| Immigrants | Northern Europe | 99.3 /100 | #56 | Exceptional 48.6% |
| Poles | 99.2 /100 | #57 | Exceptional 48.5% |
| Immigrants | Indonesia | 99.2 /100 | #58 | Exceptional 48.5% |
| Czechoslovakians | 99.2 /100 | #59 | Exceptional 48.5% |
| Croatians | 99.1 /100 | #60 | Exceptional 48.5% |
| Bulgarians | 99.1 /100 | #61 | Exceptional 48.5% |
| Luxembourgers | 99.1 /100 | #62 | Exceptional 48.5% |
| Basques | 99.0 /100 | #63 | Exceptional 48.4% |