Immigrants from Hong Kong vs Apache Unemployment Among Women with Children Under 18 years
COMPARE
Immigrants from Hong Kong
Apache
Unemployment Among Women with Children Under 18 years
Unemployment Among Women with Children Under 18 years Comparison
Immigrants from Hong Kong
Apache
4.7%
UNEMPLOYMENT AMONG WOMEN WITH CHILDREN UNDER 18 YEARS
100.0/ 100
METRIC RATING
8th/ 347
METRIC RANK
7.9%
UNEMPLOYMENT AMONG WOMEN WITH CHILDREN UNDER 18 YEARS
0.0/ 100
METRIC RATING
335th/ 347
METRIC RANK
Immigrants from Hong Kong vs Apache Unemployment Among Women with Children Under 18 years Correlation Chart
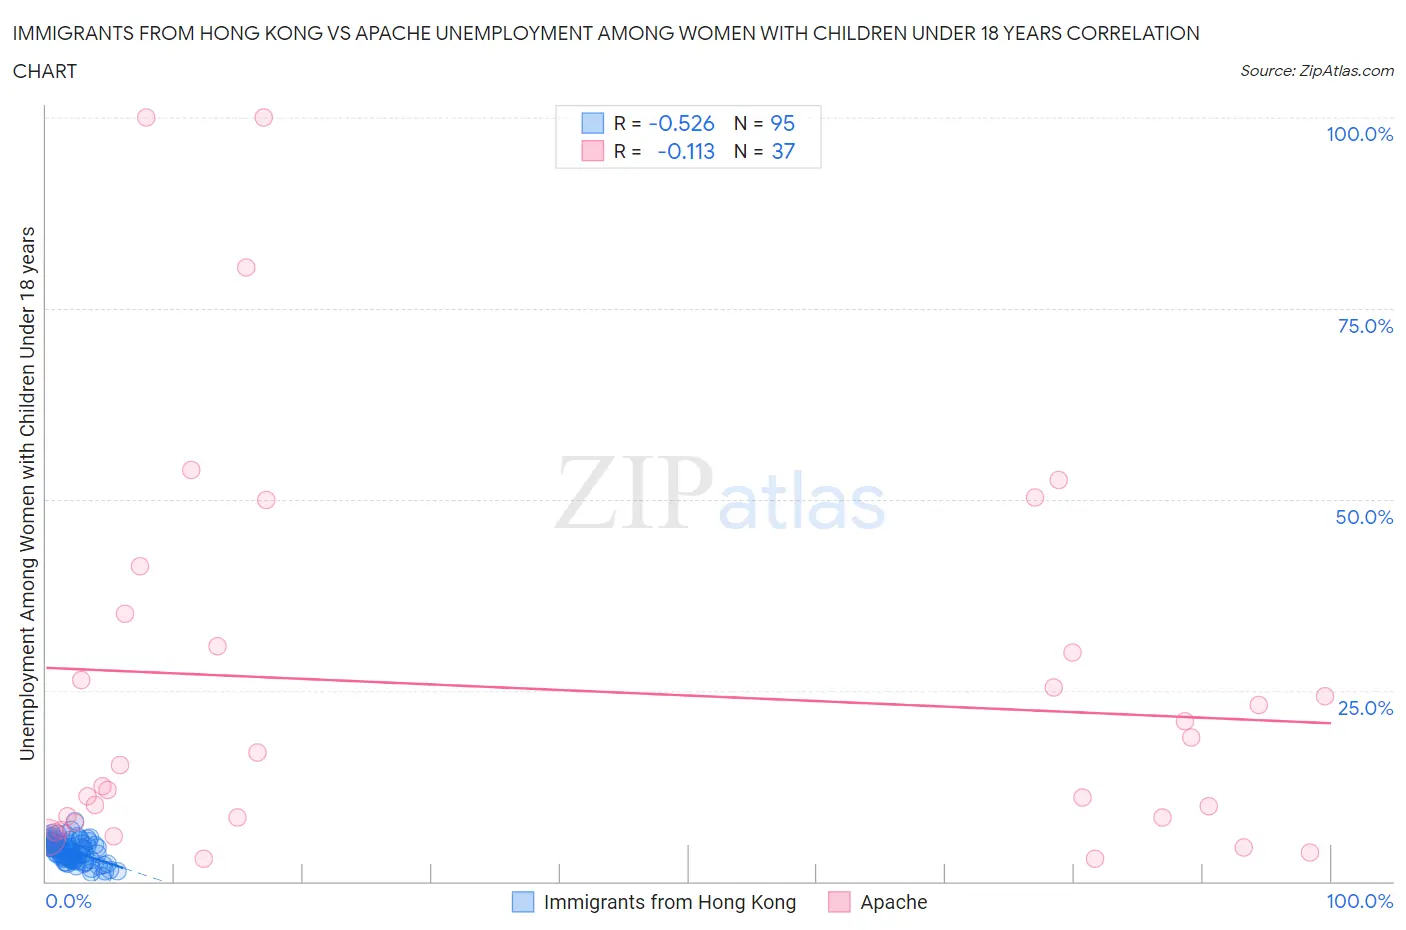
The statistical analysis conducted on geographies consisting of 248,601,917 people shows a substantial negative correlation between the proportion of Immigrants from Hong Kong and unemployment rate among women with children under the age of 18 in the United States with a correlation coefficient (R) of -0.526 and weighted average of 4.7%. Similarly, the statistical analysis conducted on geographies consisting of 224,768,063 people shows a poor negative correlation between the proportion of Apache and unemployment rate among women with children under the age of 18 in the United States with a correlation coefficient (R) of -0.113 and weighted average of 7.9%, a difference of 68.8%.
Unemployment Among Women with Children Under 18 years Correlation Summary
| Measurement | Immigrants from Hong Kong | Apache |
| Minimum | 0.60% | 2.9% |
| Maximum | 7.9% | 100.0% |
| Range | 7.3% | 97.1% |
| Mean | 4.0% | 25.2% |
| Median | 4.3% | 15.3% |
| Interquartile 25% (IQ1) | 3.0% | 8.1% |
| Interquartile 75% (IQ3) | 5.0% | 33.0% |
| Interquartile Range (IQR) | 2.0% | 24.9% |
| Standard Deviation (Sample) | 1.4% | 25.5% |
| Standard Deviation (Population) | 1.4% | 25.1% |
Similar Demographics by Unemployment Among Women with Children Under 18 years
Demographics Similar to Immigrants from Hong Kong by Unemployment Among Women with Children Under 18 years
In terms of unemployment among women with children under 18 years, the demographic groups most similar to Immigrants from Hong Kong are Immigrants from India (4.7%, a difference of 0.42%), Immigrants from Taiwan (4.7%, a difference of 0.53%), Tongan (4.7%, a difference of 0.63%), Swedish (4.7%, a difference of 0.69%), and Okinawan (4.7%, a difference of 0.84%).
| Demographics | Rating | Rank | Unemployment Among Women with Children Under 18 years |
| Norwegians | 100.0 /100 | #1 | Exceptional 4.4% |
| Hmong | 100.0 /100 | #2 | Exceptional 4.5% |
| Danes | 100.0 /100 | #3 | Exceptional 4.5% |
| Swedes | 100.0 /100 | #4 | Exceptional 4.7% |
| Tongans | 100.0 /100 | #5 | Exceptional 4.7% |
| Immigrants | Taiwan | 100.0 /100 | #6 | Exceptional 4.7% |
| Immigrants | India | 100.0 /100 | #7 | Exceptional 4.7% |
| Immigrants | Hong Kong | 100.0 /100 | #8 | Exceptional 4.7% |
| Okinawans | 99.9 /100 | #9 | Exceptional 4.7% |
| Czechs | 99.9 /100 | #10 | Exceptional 4.7% |
| Filipinos | 99.9 /100 | #11 | Exceptional 4.8% |
| Scandinavians | 99.9 /100 | #12 | Exceptional 4.8% |
| Bulgarians | 99.9 /100 | #13 | Exceptional 4.8% |
| Cambodians | 99.9 /100 | #14 | Exceptional 4.8% |
| Thais | 99.8 /100 | #15 | Exceptional 4.8% |
Demographics Similar to Apache by Unemployment Among Women with Children Under 18 years
In terms of unemployment among women with children under 18 years, the demographic groups most similar to Apache are Sioux (7.9%, a difference of 0.30%), Cheyenne (7.8%, a difference of 0.98%), Yakama (8.1%, a difference of 1.7%), Immigrants from Yemen (8.2%, a difference of 3.4%), and Navajo (8.2%, a difference of 3.9%).
| Demographics | Rating | Rank | Unemployment Among Women with Children Under 18 years |
| Natives/Alaskans | 0.0 /100 | #328 | Tragic 7.2% |
| Blacks/African Americans | 0.0 /100 | #329 | Tragic 7.3% |
| Colville | 0.0 /100 | #330 | Tragic 7.4% |
| Hopi | 0.0 /100 | #331 | Tragic 7.4% |
| Dominicans | 0.0 /100 | #332 | Tragic 7.5% |
| Immigrants | Dominican Republic | 0.0 /100 | #333 | Tragic 7.5% |
| Cheyenne | 0.0 /100 | #334 | Tragic 7.8% |
| Apache | 0.0 /100 | #335 | Tragic 7.9% |
| Sioux | 0.0 /100 | #336 | Tragic 7.9% |
| Yakama | 0.0 /100 | #337 | Tragic 8.1% |
| Immigrants | Yemen | 0.0 /100 | #338 | Tragic 8.2% |
| Navajo | 0.0 /100 | #339 | Tragic 8.2% |
| Crow | 0.0 /100 | #340 | Tragic 8.2% |
| Tohono O'odham | 0.0 /100 | #341 | Tragic 8.9% |
| Puerto Ricans | 0.0 /100 | #342 | Tragic 9.0% |