Immigrants from Hong Kong vs Brazilian Family Households with Children
COMPARE
Immigrants from Hong Kong
Brazilian
Family Households with Children
Family Households with Children Comparison
Immigrants from Hong Kong
Brazilians
27.5%
FAMILY HOUSEHOLDS WITH CHILDREN
64.9/ 100
METRIC RATING
164th/ 347
METRIC RANK
27.7%
FAMILY HOUSEHOLDS WITH CHILDREN
79.6/ 100
METRIC RATING
144th/ 347
METRIC RANK
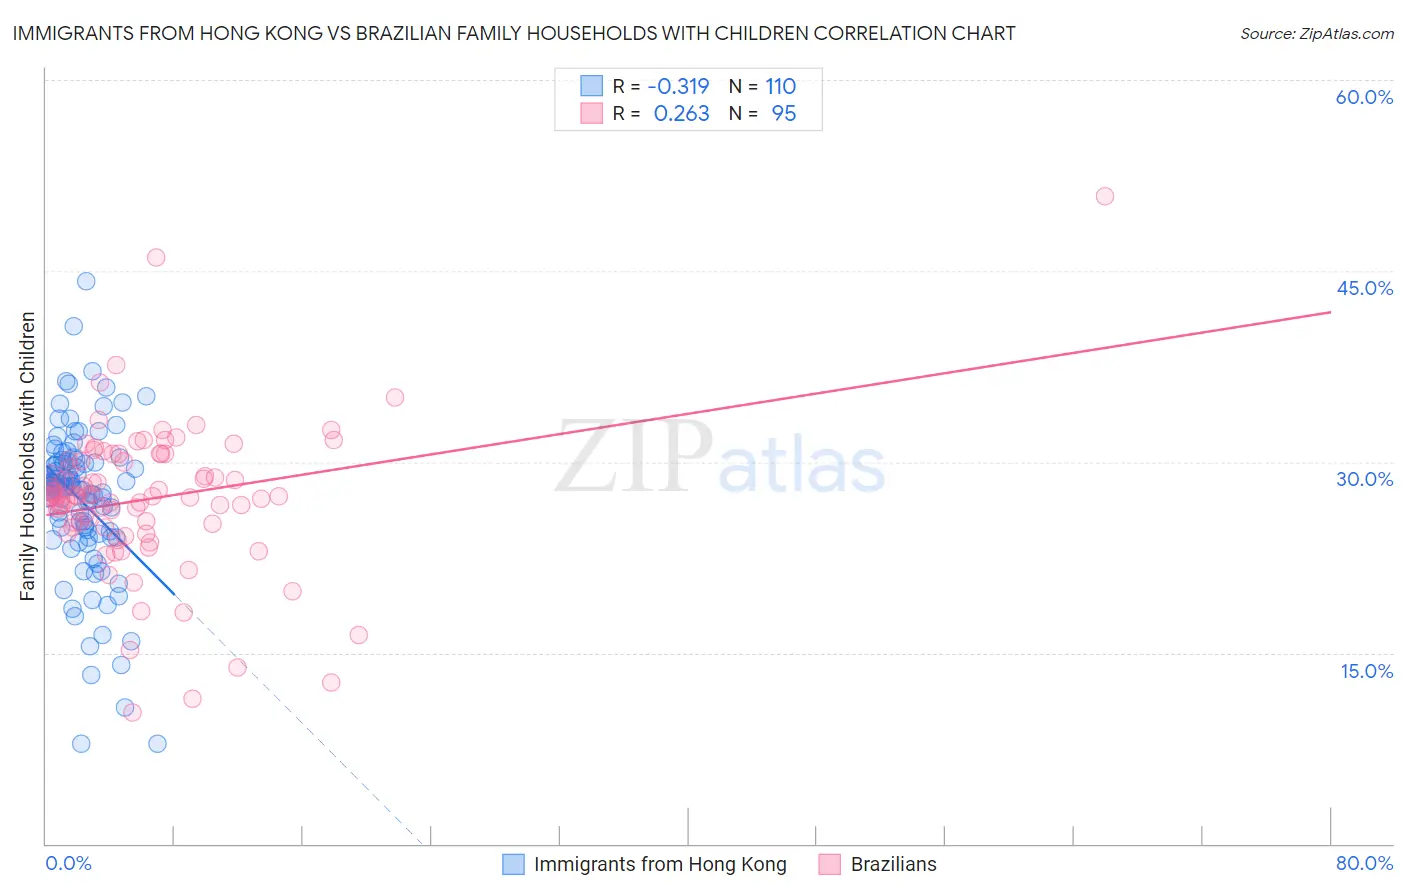
Immigrants from Hong Kong vs Brazilian Family Households with Children Correlation Chart
The statistical analysis conducted on geographies consisting of 253,815,844 people shows a mild negative correlation between the proportion of Immigrants from Hong Kong and percentage of family households with children in the United States with a correlation coefficient (R) of -0.319 and weighted average of 27.5%. Similarly, the statistical analysis conducted on geographies consisting of 323,614,103 people shows a weak positive correlation between the proportion of Brazilians and percentage of family households with children in the United States with a correlation coefficient (R) of 0.263 and weighted average of 27.7%, a difference of 0.41%.
Family Households with Children Correlation Summary
| Measurement | Immigrants from Hong Kong | Brazilian |
| Minimum | 7.8% | 10.3% |
| Maximum | 44.2% | 50.9% |
| Range | 36.3% | 40.6% |
| Mean | 26.9% | 27.1% |
| Median | 28.0% | 27.3% |
| Interquartile 25% (IQ1) | 24.3% | 24.9% |
| Interquartile 75% (IQ3) | 30.0% | 30.6% |
| Interquartile Range (IQR) | 5.6% | 5.7% |
| Standard Deviation (Sample) | 6.0% | 5.9% |
| Standard Deviation (Population) | 6.0% | 5.9% |
Demographics Similar to Immigrants from Hong Kong and Brazilians by Family Households with Children
In terms of family households with children, the demographic groups most similar to Immigrants from Hong Kong are Czech (27.5%, a difference of 0.010%), Alaskan Athabascan (27.6%, a difference of 0.050%), Immigrants from Bangladesh (27.6%, a difference of 0.050%), Subsaharan African (27.6%, a difference of 0.060%), and Romanian (27.6%, a difference of 0.15%). Similarly, the demographic groups most similar to Brazilians are Immigrants from Chile (27.7%, a difference of 0.010%), Basque (27.7%, a difference of 0.010%), Immigrants from Moldova (27.6%, a difference of 0.020%), Osage (27.6%, a difference of 0.020%), and Menominee (27.6%, a difference of 0.020%).
| Demographics | Rating | Rank | Family Households with Children |
| Brazilians | 79.6 /100 | #144 | Good 27.7% |
| Immigrants | Chile | 79.5 /100 | #145 | Good 27.7% |
| Basques | 79.5 /100 | #146 | Good 27.7% |
| Immigrants | Moldova | 79.1 /100 | #147 | Good 27.6% |
| Osage | 79.0 /100 | #148 | Good 27.6% |
| Menominee | 78.9 /100 | #149 | Good 27.6% |
| Argentineans | 78.5 /100 | #150 | Good 27.6% |
| Portuguese | 77.8 /100 | #151 | Good 27.6% |
| Ethiopians | 77.0 /100 | #152 | Good 27.6% |
| Immigrants | Cabo Verde | 75.6 /100 | #153 | Good 27.6% |
| Icelanders | 75.3 /100 | #154 | Good 27.6% |
| Comanche | 74.8 /100 | #155 | Good 27.6% |
| Hungarians | 74.6 /100 | #156 | Good 27.6% |
| Indians (Asian) | 71.6 /100 | #157 | Good 27.6% |
| Romanians | 70.8 /100 | #158 | Good 27.6% |
| Mongolians | 70.7 /100 | #159 | Good 27.6% |
| Sub-Saharan Africans | 67.5 /100 | #160 | Good 27.6% |
| Alaskan Athabascans | 67.1 /100 | #161 | Good 27.6% |
| Immigrants | Bangladesh | 67.0 /100 | #162 | Good 27.6% |
| Czechs | 65.3 /100 | #163 | Good 27.5% |
| Immigrants | Hong Kong | 64.9 /100 | #164 | Good 27.5% |