Immigrants from Hong Kong vs Apache In Labor Force | Age 25-29
COMPARE
Immigrants from Hong Kong
Apache
In Labor Force | Age 25-29
In Labor Force | Age 25-29 Comparison
Immigrants from Hong Kong
Apache
85.0%
IN LABOR FORCE | AGE 25-29
92.8/ 100
METRIC RATING
105th/ 347
METRIC RANK
79.2%
IN LABOR FORCE | AGE 25-29
0.0/ 100
METRIC RATING
336th/ 347
METRIC RANK
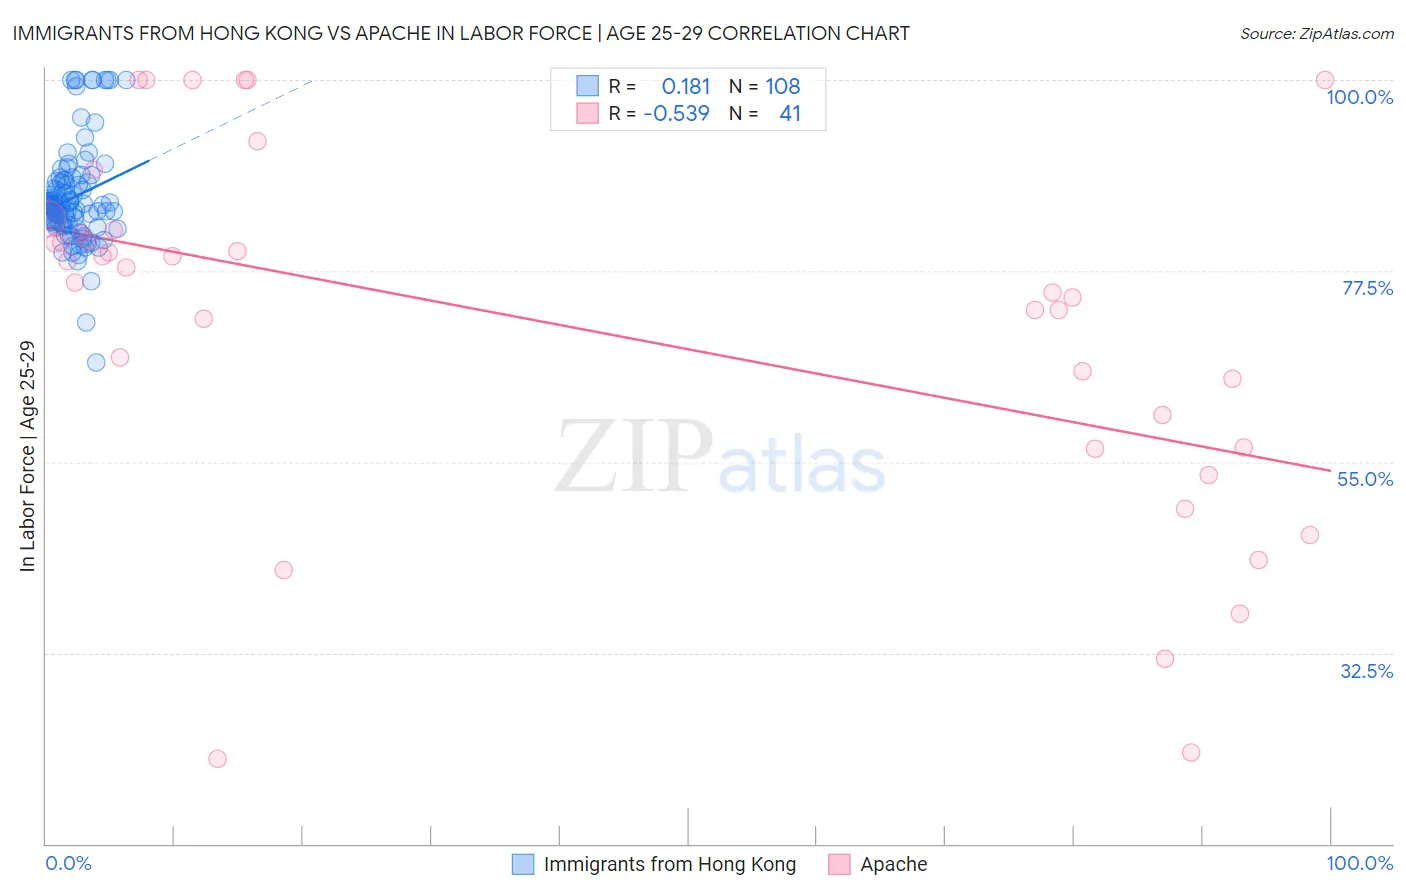
Immigrants from Hong Kong vs Apache In Labor Force | Age 25-29 Correlation Chart
The statistical analysis conducted on geographies consisting of 253,942,072 people shows a poor positive correlation between the proportion of Immigrants from Hong Kong and labor force participation rate among population between the ages 25 and 29 in the United States with a correlation coefficient (R) of 0.181 and weighted average of 85.0%. Similarly, the statistical analysis conducted on geographies consisting of 231,063,738 people shows a substantial negative correlation between the proportion of Apache and labor force participation rate among population between the ages 25 and 29 in the United States with a correlation coefficient (R) of -0.539 and weighted average of 79.2%, a difference of 7.4%.
In Labor Force | Age 25-29 Correlation Summary
| Measurement | Immigrants from Hong Kong | Apache |
| Minimum | 66.7% | 20.0% |
| Maximum | 100.0% | 100.0% |
| Range | 33.3% | 80.0% |
| Mean | 86.1% | 70.9% |
| Median | 85.3% | 76.2% |
| Interquartile 25% (IQ1) | 83.0% | 56.6% |
| Interquartile 75% (IQ3) | 88.0% | 82.1% |
| Interquartile Range (IQR) | 5.0% | 25.5% |
| Standard Deviation (Sample) | 5.9% | 21.4% |
| Standard Deviation (Population) | 5.9% | 21.2% |
Similar Demographics by In Labor Force | Age 25-29
Demographics Similar to Immigrants from Hong Kong by In Labor Force | Age 25-29
In terms of in labor force | age 25-29, the demographic groups most similar to Immigrants from Hong Kong are Czechoslovakian (85.0%, a difference of 0.0%), Immigrants from Zaire (85.1%, a difference of 0.010%), Immigrants from Southern Europe (85.0%, a difference of 0.010%), Immigrants from Japan (85.1%, a difference of 0.020%), and Immigrants from Austria (85.0%, a difference of 0.020%).
| Demographics | Rating | Rank | In Labor Force | Age 25-29 |
| Mongolians | 94.1 /100 | #98 | Exceptional 85.1% |
| Bangladeshis | 94.0 /100 | #99 | Exceptional 85.1% |
| Immigrants | Switzerland | 93.9 /100 | #100 | Exceptional 85.1% |
| Egyptians | 93.8 /100 | #101 | Exceptional 85.1% |
| Slavs | 93.7 /100 | #102 | Exceptional 85.1% |
| Immigrants | Japan | 93.5 /100 | #103 | Exceptional 85.1% |
| Immigrants | Zaire | 93.3 /100 | #104 | Exceptional 85.1% |
| Immigrants | Hong Kong | 92.8 /100 | #105 | Exceptional 85.0% |
| Czechoslovakians | 92.6 /100 | #106 | Exceptional 85.0% |
| Immigrants | Southern Europe | 92.3 /100 | #107 | Exceptional 85.0% |
| Immigrants | Austria | 91.9 /100 | #108 | Exceptional 85.0% |
| Costa Ricans | 91.9 /100 | #109 | Exceptional 85.0% |
| New Zealanders | 91.5 /100 | #110 | Exceptional 85.0% |
| Immigrants | Middle Africa | 91.4 /100 | #111 | Exceptional 85.0% |
| Senegalese | 90.9 /100 | #112 | Exceptional 85.0% |
Demographics Similar to Apache by In Labor Force | Age 25-29
In terms of in labor force | age 25-29, the demographic groups most similar to Apache are Native/Alaskan (79.3%, a difference of 0.070%), Yuman (79.3%, a difference of 0.16%), Sioux (79.7%, a difference of 0.57%), Inupiat (79.8%, a difference of 0.68%), and Crow (78.6%, a difference of 0.76%).
| Demographics | Rating | Rank | In Labor Force | Age 25-29 |
| Yakama | 0.0 /100 | #329 | Tragic 80.6% |
| Puerto Ricans | 0.0 /100 | #330 | Tragic 80.4% |
| Cheyenne | 0.0 /100 | #331 | Tragic 80.3% |
| Inupiat | 0.0 /100 | #332 | Tragic 79.8% |
| Sioux | 0.0 /100 | #333 | Tragic 79.7% |
| Yuman | 0.0 /100 | #334 | Tragic 79.3% |
| Natives/Alaskans | 0.0 /100 | #335 | Tragic 79.3% |
| Apache | 0.0 /100 | #336 | Tragic 79.2% |
| Crow | 0.0 /100 | #337 | Tragic 78.6% |
| Lumbee | 0.0 /100 | #338 | Tragic 78.3% |
| Immigrants | Yemen | 0.0 /100 | #339 | Tragic 78.2% |
| Paiute | 0.0 /100 | #340 | Tragic 78.1% |
| Tohono O'odham | 0.0 /100 | #341 | Tragic 77.5% |
| Pueblo | 0.0 /100 | #342 | Tragic 77.5% |
| Arapaho | 0.0 /100 | #343 | Tragic 76.6% |