Immigrants from Hong Kong vs Apache Disability Age 35 to 64
COMPARE
Immigrants from Hong Kong
Apache
Disability Age 35 to 64
Disability Age 35 to 64 Comparison
Immigrants from Hong Kong
Apache
8.2%
DISABILITY AGE 35 TO 64
100.0/ 100
METRIC RATING
3rd/ 347
METRIC RANK
14.9%
DISABILITY AGE 35 TO 64
0.0/ 100
METRIC RATING
323rd/ 347
METRIC RANK
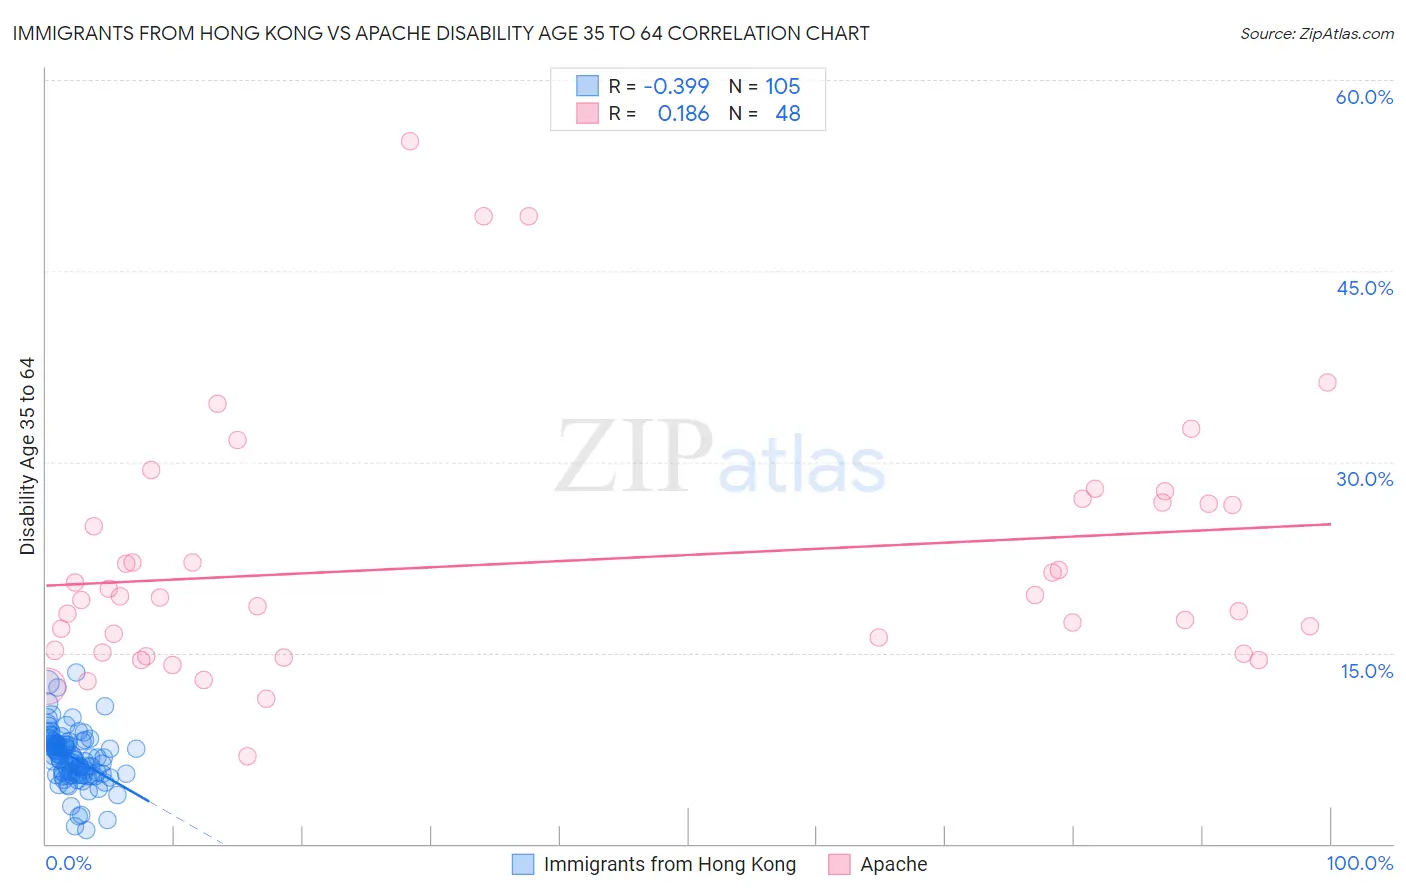
Immigrants from Hong Kong vs Apache Disability Age 35 to 64 Correlation Chart
The statistical analysis conducted on geographies consisting of 253,870,545 people shows a mild negative correlation between the proportion of Immigrants from Hong Kong and percentage of population with a disability between the ages 34 and 64 in the United States with a correlation coefficient (R) of -0.399 and weighted average of 8.2%. Similarly, the statistical analysis conducted on geographies consisting of 231,024,095 people shows a poor positive correlation between the proportion of Apache and percentage of population with a disability between the ages 34 and 64 in the United States with a correlation coefficient (R) of 0.186 and weighted average of 14.9%, a difference of 82.2%.
Disability Age 35 to 64 Correlation Summary
| Measurement | Immigrants from Hong Kong | Apache |
| Minimum | 1.1% | 6.9% |
| Maximum | 13.5% | 55.2% |
| Range | 12.4% | 48.3% |
| Mean | 6.8% | 22.1% |
| Median | 6.7% | 19.4% |
| Interquartile 25% (IQ1) | 5.4% | 15.1% |
| Interquartile 75% (IQ3) | 7.9% | 26.8% |
| Interquartile Range (IQR) | 2.4% | 11.7% |
| Standard Deviation (Sample) | 2.1% | 9.9% |
| Standard Deviation (Population) | 2.1% | 9.8% |
Similar Demographics by Disability Age 35 to 64
Demographics Similar to Immigrants from Hong Kong by Disability Age 35 to 64
In terms of disability age 35 to 64, the demographic groups most similar to Immigrants from Hong Kong are Immigrants from India (8.3%, a difference of 1.1%), Filipino (8.0%, a difference of 1.8%), Immigrants from Iran (8.5%, a difference of 3.6%), Immigrants from Taiwan (7.8%, a difference of 4.4%), and Thai (8.6%, a difference of 4.6%).
| Demographics | Rating | Rank | Disability Age 35 to 64 |
| Immigrants | Taiwan | 100.0 /100 | #1 | Exceptional 7.8% |
| Filipinos | 100.0 /100 | #2 | Exceptional 8.0% |
| Immigrants | Hong Kong | 100.0 /100 | #3 | Exceptional 8.2% |
| Immigrants | India | 100.0 /100 | #4 | Exceptional 8.3% |
| Immigrants | Iran | 100.0 /100 | #5 | Exceptional 8.5% |
| Thais | 100.0 /100 | #6 | Exceptional 8.6% |
| Immigrants | Israel | 100.0 /100 | #7 | Exceptional 8.6% |
| Iranians | 100.0 /100 | #8 | Exceptional 8.7% |
| Immigrants | China | 100.0 /100 | #9 | Exceptional 8.7% |
| Immigrants | Bolivia | 100.0 /100 | #10 | Exceptional 8.7% |
| Immigrants | Eastern Asia | 100.0 /100 | #11 | Exceptional 8.8% |
| Indians (Asian) | 100.0 /100 | #12 | Exceptional 8.9% |
| Immigrants | South Central Asia | 100.0 /100 | #13 | Exceptional 8.9% |
| Immigrants | Singapore | 100.0 /100 | #14 | Exceptional 8.9% |
| Bolivians | 100.0 /100 | #15 | Exceptional 8.9% |
Demographics Similar to Apache by Disability Age 35 to 64
In terms of disability age 35 to 64, the demographic groups most similar to Apache are Chippewa (15.0%, a difference of 0.20%), Arapaho (15.1%, a difference of 0.87%), Potawatomi (14.8%, a difference of 1.2%), Comanche (14.7%, a difference of 1.3%), and Black/African American (14.7%, a difference of 1.5%).
| Demographics | Rating | Rank | Disability Age 35 to 64 |
| Osage | 0.0 /100 | #316 | Tragic 14.5% |
| Crow | 0.0 /100 | #317 | Tragic 14.6% |
| Ottawa | 0.0 /100 | #318 | Tragic 14.6% |
| Immigrants | Cabo Verde | 0.0 /100 | #319 | Tragic 14.7% |
| Blacks/African Americans | 0.0 /100 | #320 | Tragic 14.7% |
| Comanche | 0.0 /100 | #321 | Tragic 14.7% |
| Potawatomi | 0.0 /100 | #322 | Tragic 14.8% |
| Apache | 0.0 /100 | #323 | Tragic 14.9% |
| Chippewa | 0.0 /100 | #324 | Tragic 15.0% |
| Arapaho | 0.0 /100 | #325 | Tragic 15.1% |
| Natives/Alaskans | 0.0 /100 | #326 | Tragic 15.3% |
| Pueblo | 0.0 /100 | #327 | Tragic 15.3% |
| Cajuns | 0.0 /100 | #328 | Tragic 15.3% |
| Cherokee | 0.0 /100 | #329 | Tragic 15.5% |
| Navajo | 0.0 /100 | #330 | Tragic 15.5% |