Nigerian vs Immigrants from Hungary Married-couple Households
COMPARE
Nigerian
Immigrants from Hungary
Married-couple Households
Married-couple Households Comparison
Nigerians
Immigrants from Hungary
43.2%
MARRIED-COUPLE HOUSEHOLDS
0.1/ 100
METRIC RATING
274th/ 347
METRIC RANK
47.3%
MARRIED-COUPLE HOUSEHOLDS
87.8/ 100
METRIC RATING
130th/ 347
METRIC RANK
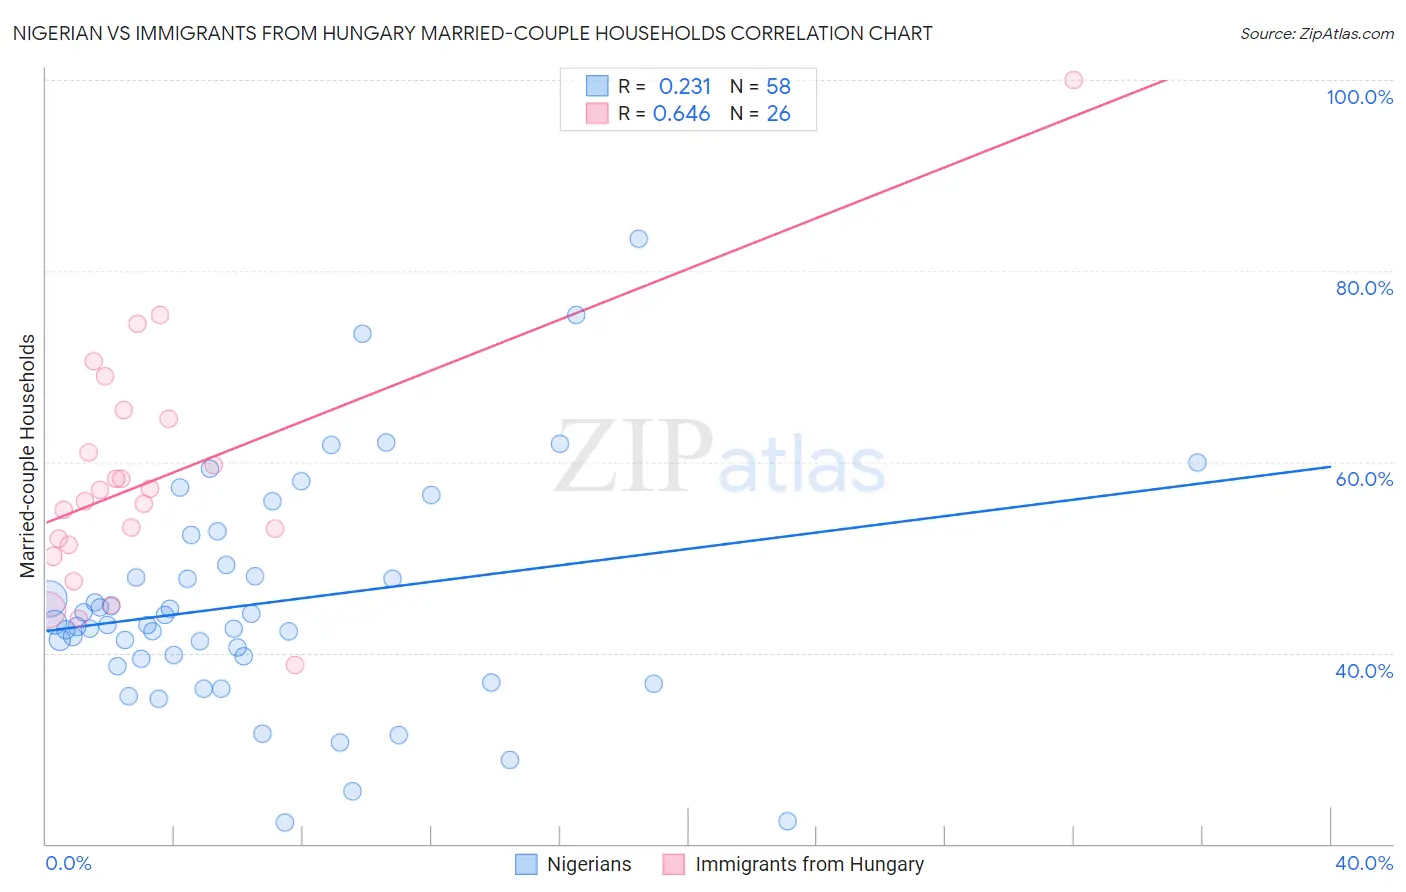
Nigerian vs Immigrants from Hungary Married-couple Households Correlation Chart
The statistical analysis conducted on geographies consisting of 332,444,771 people shows a weak positive correlation between the proportion of Nigerians and percentage of married-couple family households in the United States with a correlation coefficient (R) of 0.231 and weighted average of 43.2%. Similarly, the statistical analysis conducted on geographies consisting of 195,664,672 people shows a significant positive correlation between the proportion of Immigrants from Hungary and percentage of married-couple family households in the United States with a correlation coefficient (R) of 0.646 and weighted average of 47.3%, a difference of 9.6%.
Married-couple Households Correlation Summary
| Measurement | Nigerian | Immigrants from Hungary |
| Minimum | 22.2% | 38.7% |
| Maximum | 83.4% | 100.0% |
| Range | 61.2% | 61.3% |
| Mean | 45.2% | 58.3% |
| Median | 42.9% | 56.5% |
| Interquartile 25% (IQ1) | 39.4% | 51.2% |
| Interquartile 75% (IQ3) | 49.2% | 64.5% |
| Interquartile Range (IQR) | 9.7% | 13.2% |
| Standard Deviation (Sample) | 12.0% | 12.6% |
| Standard Deviation (Population) | 11.9% | 12.4% |
Similar Demographics by Married-couple Households
Demographics Similar to Nigerians by Married-couple Households
In terms of married-couple households, the demographic groups most similar to Nigerians are Ethiopian (43.2%, a difference of 0.010%), Immigrants from Nigeria (43.2%, a difference of 0.11%), Immigrants from Bangladesh (43.1%, a difference of 0.14%), Guatemalan (43.3%, a difference of 0.21%), and Immigrants from Ethiopia (43.1%, a difference of 0.25%).
| Demographics | Rating | Rank | Married-couple Households |
| Natives/Alaskans | 0.1 /100 | #267 | Tragic 43.5% |
| Immigrants | Burma/Myanmar | 0.1 /100 | #268 | Tragic 43.4% |
| Immigrants | Sierra Leone | 0.1 /100 | #269 | Tragic 43.3% |
| Yuman | 0.1 /100 | #270 | Tragic 43.3% |
| Guatemalans | 0.1 /100 | #271 | Tragic 43.3% |
| Immigrants | Nigeria | 0.1 /100 | #272 | Tragic 43.2% |
| Ethiopians | 0.1 /100 | #273 | Tragic 43.2% |
| Nigerians | 0.1 /100 | #274 | Tragic 43.2% |
| Immigrants | Bangladesh | 0.0 /100 | #275 | Tragic 43.1% |
| Immigrants | Ethiopia | 0.0 /100 | #276 | Tragic 43.1% |
| Immigrants | Eastern Africa | 0.0 /100 | #277 | Tragic 42.9% |
| Immigrants | Africa | 0.0 /100 | #278 | Tragic 42.9% |
| Sierra Leoneans | 0.0 /100 | #279 | Tragic 42.9% |
| Immigrants | Ecuador | 0.0 /100 | #280 | Tragic 42.9% |
| Immigrants | Guatemala | 0.0 /100 | #281 | Tragic 42.8% |
Demographics Similar to Immigrants from Hungary by Married-couple Households
In terms of married-couple households, the demographic groups most similar to Immigrants from Hungary are Immigrants from Iraq (47.3%, a difference of 0.0%), Immigrants from Peru (47.3%, a difference of 0.010%), Immigrants from Denmark (47.3%, a difference of 0.020%), Celtic (47.3%, a difference of 0.030%), and Pakistani (47.3%, a difference of 0.070%).
| Demographics | Rating | Rank | Married-couple Households |
| Immigrants | Venezuela | 89.3 /100 | #123 | Excellent 47.4% |
| Zimbabweans | 89.2 /100 | #124 | Excellent 47.4% |
| Australians | 89.0 /100 | #125 | Excellent 47.4% |
| Pakistanis | 88.6 /100 | #126 | Excellent 47.3% |
| Celtics | 88.1 /100 | #127 | Excellent 47.3% |
| Immigrants | Peru | 87.9 /100 | #128 | Excellent 47.3% |
| Immigrants | Iraq | 87.8 /100 | #129 | Excellent 47.3% |
| Immigrants | Hungary | 87.8 /100 | #130 | Excellent 47.3% |
| Immigrants | Denmark | 87.5 /100 | #131 | Excellent 47.3% |
| Immigrants | Ukraine | 86.7 /100 | #132 | Excellent 47.3% |
| South Africans | 86.4 /100 | #133 | Excellent 47.3% |
| Immigrants | Greece | 86.0 /100 | #134 | Excellent 47.2% |
| Immigrants | Argentina | 86.0 /100 | #135 | Excellent 47.2% |
| New Zealanders | 85.3 /100 | #136 | Excellent 47.2% |
| Immigrants | Malaysia | 85.2 /100 | #137 | Excellent 47.2% |