Immigrants from Ghana vs Immigrants from Germany Family Households
COMPARE
Immigrants from Ghana
Immigrants from Germany
Family Households
Family Households Comparison
Immigrants from Ghana
Immigrants from Germany
63.4%
FAMILY HOUSEHOLDS
1.6/ 100
METRIC RATING
246th/ 347
METRIC RANK
64.3%
FAMILY HOUSEHOLDS
50.0/ 100
METRIC RATING
174th/ 347
METRIC RANK
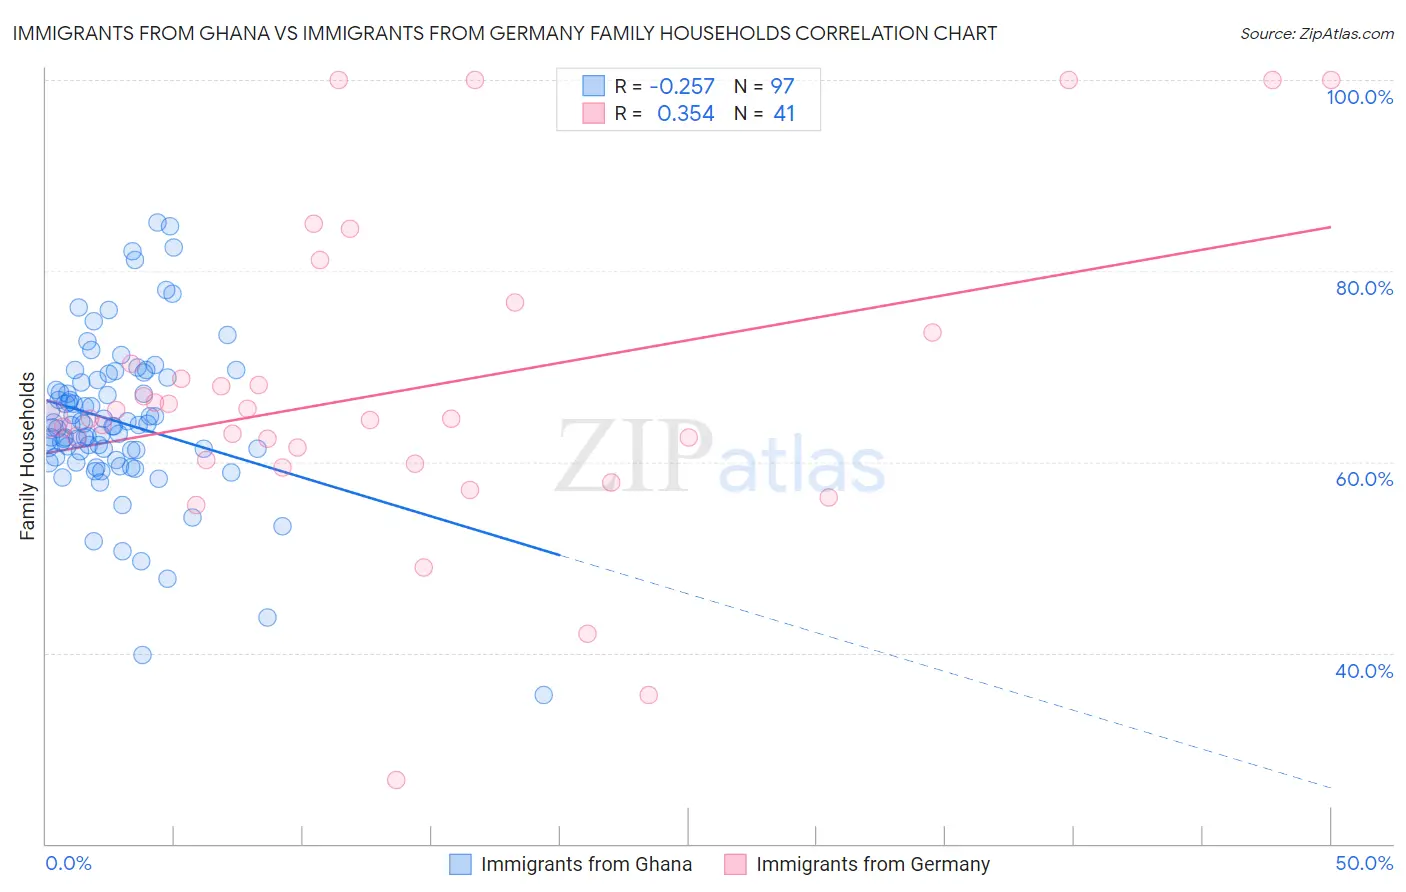
Immigrants from Ghana vs Immigrants from Germany Family Households Correlation Chart
The statistical analysis conducted on geographies consisting of 199,806,163 people shows a weak negative correlation between the proportion of Immigrants from Ghana and percentage of family households in the United States with a correlation coefficient (R) of -0.257 and weighted average of 63.4%. Similarly, the statistical analysis conducted on geographies consisting of 463,759,917 people shows a mild positive correlation between the proportion of Immigrants from Germany and percentage of family households in the United States with a correlation coefficient (R) of 0.354 and weighted average of 64.3%, a difference of 1.4%.
Family Households Correlation Summary
| Measurement | Immigrants from Ghana | Immigrants from Germany |
| Minimum | 35.6% | 26.7% |
| Maximum | 85.0% | 100.0% |
| Range | 49.4% | 73.3% |
| Mean | 64.2% | 67.4% |
| Median | 63.8% | 64.5% |
| Interquartile 25% (IQ1) | 60.8% | 60.0% |
| Interquartile 75% (IQ3) | 68.4% | 71.9% |
| Interquartile Range (IQR) | 7.6% | 11.9% |
| Standard Deviation (Sample) | 8.3% | 16.4% |
| Standard Deviation (Population) | 8.2% | 16.2% |
Similar Demographics by Family Households
Demographics Similar to Immigrants from Ghana by Family Households
In terms of family households, the demographic groups most similar to Immigrants from Ghana are Immigrants from Uzbekistan (63.4%, a difference of 0.010%), Eastern European (63.4%, a difference of 0.020%), Immigrants from Dominica (63.4%, a difference of 0.020%), Dominican (63.4%, a difference of 0.020%), and Russian (63.4%, a difference of 0.030%).
| Demographics | Rating | Rank | Family Households |
| Aleuts | 1.9 /100 | #239 | Tragic 63.4% |
| South Africans | 1.9 /100 | #240 | Tragic 63.4% |
| Immigrants | St. Vincent and the Grenadines | 1.9 /100 | #241 | Tragic 63.4% |
| Immigrants | Israel | 1.8 /100 | #242 | Tragic 63.4% |
| Immigrants | Czechoslovakia | 1.8 /100 | #243 | Tragic 63.4% |
| Eastern Europeans | 1.6 /100 | #244 | Tragic 63.4% |
| Immigrants | Dominica | 1.6 /100 | #245 | Tragic 63.4% |
| Immigrants | Ghana | 1.6 /100 | #246 | Tragic 63.4% |
| Immigrants | Uzbekistan | 1.5 /100 | #247 | Tragic 63.4% |
| Dominicans | 1.5 /100 | #248 | Tragic 63.4% |
| Russians | 1.4 /100 | #249 | Tragic 63.4% |
| Immigrants | Japan | 1.4 /100 | #250 | Tragic 63.4% |
| Taiwanese | 1.2 /100 | #251 | Tragic 63.3% |
| Bahamians | 1.1 /100 | #252 | Tragic 63.3% |
| Immigrants | Dominican Republic | 1.0 /100 | #253 | Tragic 63.3% |
Demographics Similar to Immigrants from Germany by Family Households
In terms of family households, the demographic groups most similar to Immigrants from Germany are Immigrants from Sierra Leone (64.3%, a difference of 0.030%), Dutch West Indian (64.3%, a difference of 0.050%), Ute (64.3%, a difference of 0.060%), Iraqi (64.4%, a difference of 0.080%), and Armenian (64.4%, a difference of 0.080%).
| Demographics | Rating | Rank | Family Households |
| Irish | 57.9 /100 | #167 | Average 64.4% |
| Hondurans | 57.5 /100 | #168 | Average 64.4% |
| Iraqis | 56.0 /100 | #169 | Average 64.4% |
| Armenians | 55.9 /100 | #170 | Average 64.4% |
| Ute | 54.6 /100 | #171 | Average 64.3% |
| Dutch West Indians | 53.9 /100 | #172 | Average 64.3% |
| Immigrants | Sierra Leone | 52.5 /100 | #173 | Average 64.3% |
| Immigrants | Germany | 50.0 /100 | #174 | Average 64.3% |
| Bangladeshis | 44.3 /100 | #175 | Average 64.3% |
| Vietnamese | 43.6 /100 | #176 | Average 64.2% |
| Immigrants | Micronesia | 42.3 /100 | #177 | Average 64.2% |
| Jamaicans | 40.6 /100 | #178 | Average 64.2% |
| Immigrants | Ukraine | 38.2 /100 | #179 | Fair 64.2% |
| Immigrants | Honduras | 35.0 /100 | #180 | Fair 64.2% |
| Immigrants | Trinidad and Tobago | 34.9 /100 | #181 | Fair 64.2% |