Immigrants from Ghana vs Afghan Family Households
COMPARE
Immigrants from Ghana
Afghan
Family Households
Family Households Comparison
Immigrants from Ghana
Afghans
63.4%
FAMILY HOUSEHOLDS
1.6/ 100
METRIC RATING
246th/ 347
METRIC RANK
66.3%
FAMILY HOUSEHOLDS
100.0/ 100
METRIC RATING
53rd/ 347
METRIC RANK
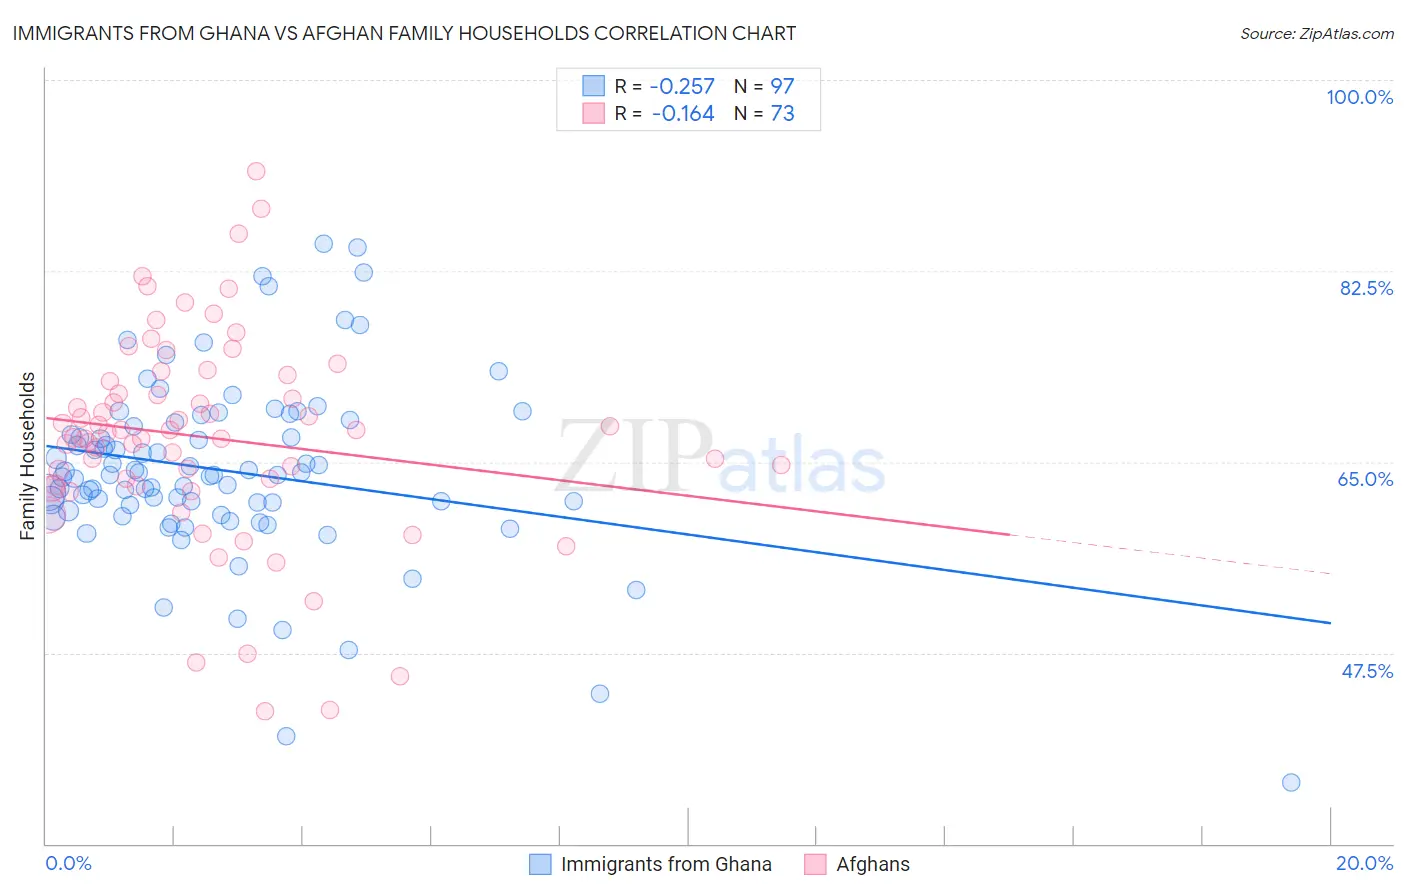
Immigrants from Ghana vs Afghan Family Households Correlation Chart
The statistical analysis conducted on geographies consisting of 199,806,163 people shows a weak negative correlation between the proportion of Immigrants from Ghana and percentage of family households in the United States with a correlation coefficient (R) of -0.257 and weighted average of 63.4%. Similarly, the statistical analysis conducted on geographies consisting of 148,833,722 people shows a poor negative correlation between the proportion of Afghans and percentage of family households in the United States with a correlation coefficient (R) of -0.164 and weighted average of 66.3%, a difference of 4.5%.
Family Households Correlation Summary
| Measurement | Immigrants from Ghana | Afghan |
| Minimum | 35.6% | 42.2% |
| Maximum | 85.0% | 91.7% |
| Range | 49.4% | 49.5% |
| Mean | 64.2% | 67.2% |
| Median | 63.8% | 67.7% |
| Interquartile 25% (IQ1) | 60.8% | 62.8% |
| Interquartile 75% (IQ3) | 68.4% | 72.6% |
| Interquartile Range (IQR) | 7.6% | 9.8% |
| Standard Deviation (Sample) | 8.3% | 9.6% |
| Standard Deviation (Population) | 8.2% | 9.6% |
Similar Demographics by Family Households
Demographics Similar to Immigrants from Ghana by Family Households
In terms of family households, the demographic groups most similar to Immigrants from Ghana are Immigrants from Uzbekistan (63.4%, a difference of 0.010%), Eastern European (63.4%, a difference of 0.020%), Immigrants from Dominica (63.4%, a difference of 0.020%), Dominican (63.4%, a difference of 0.020%), and Russian (63.4%, a difference of 0.030%).
| Demographics | Rating | Rank | Family Households |
| Aleuts | 1.9 /100 | #239 | Tragic 63.4% |
| South Africans | 1.9 /100 | #240 | Tragic 63.4% |
| Immigrants | St. Vincent and the Grenadines | 1.9 /100 | #241 | Tragic 63.4% |
| Immigrants | Israel | 1.8 /100 | #242 | Tragic 63.4% |
| Immigrants | Czechoslovakia | 1.8 /100 | #243 | Tragic 63.4% |
| Eastern Europeans | 1.6 /100 | #244 | Tragic 63.4% |
| Immigrants | Dominica | 1.6 /100 | #245 | Tragic 63.4% |
| Immigrants | Ghana | 1.6 /100 | #246 | Tragic 63.4% |
| Immigrants | Uzbekistan | 1.5 /100 | #247 | Tragic 63.4% |
| Dominicans | 1.5 /100 | #248 | Tragic 63.4% |
| Russians | 1.4 /100 | #249 | Tragic 63.4% |
| Immigrants | Japan | 1.4 /100 | #250 | Tragic 63.4% |
| Taiwanese | 1.2 /100 | #251 | Tragic 63.3% |
| Bahamians | 1.1 /100 | #252 | Tragic 63.3% |
| Immigrants | Dominican Republic | 1.0 /100 | #253 | Tragic 63.3% |
Demographics Similar to Afghans by Family Households
In terms of family households, the demographic groups most similar to Afghans are Immigrants from Colombia (66.3%, a difference of 0.0%), Colombian (66.3%, a difference of 0.010%), Native/Alaskan (66.4%, a difference of 0.14%), Navajo (66.4%, a difference of 0.17%), and Immigrants (66.1%, a difference of 0.17%).
| Demographics | Rating | Rank | Family Households |
| Arapaho | 100.0 /100 | #46 | Exceptional 66.5% |
| Bolivians | 100.0 /100 | #47 | Exceptional 66.5% |
| Immigrants | Venezuela | 100.0 /100 | #48 | Exceptional 66.4% |
| Immigrants | South Central Asia | 100.0 /100 | #49 | Exceptional 66.4% |
| Navajo | 100.0 /100 | #50 | Exceptional 66.4% |
| Natives/Alaskans | 100.0 /100 | #51 | Exceptional 66.4% |
| Colombians | 100.0 /100 | #52 | Exceptional 66.3% |
| Afghans | 100.0 /100 | #53 | Exceptional 66.3% |
| Immigrants | Colombia | 100.0 /100 | #54 | Exceptional 66.3% |
| Immigrants | Immigrants | 100.0 /100 | #55 | Exceptional 66.1% |
| Immigrants | Hong Kong | 100.0 /100 | #56 | Exceptional 66.1% |
| Pennsylvania Germans | 100.0 /100 | #57 | Exceptional 66.1% |
| Immigrants | Asia | 100.0 /100 | #58 | Exceptional 66.1% |
| Immigrants | Korea | 100.0 /100 | #59 | Exceptional 66.0% |
| South Americans | 100.0 /100 | #60 | Exceptional 66.0% |