Immigrants from Ghana vs Australian Family Households
COMPARE
Immigrants from Ghana
Australian
Family Households
Family Households Comparison
Immigrants from Ghana
Australians
63.4%
FAMILY HOUSEHOLDS
1.6/ 100
METRIC RATING
246th/ 347
METRIC RANK
62.8%
FAMILY HOUSEHOLDS
0.1/ 100
METRIC RATING
284th/ 347
METRIC RANK
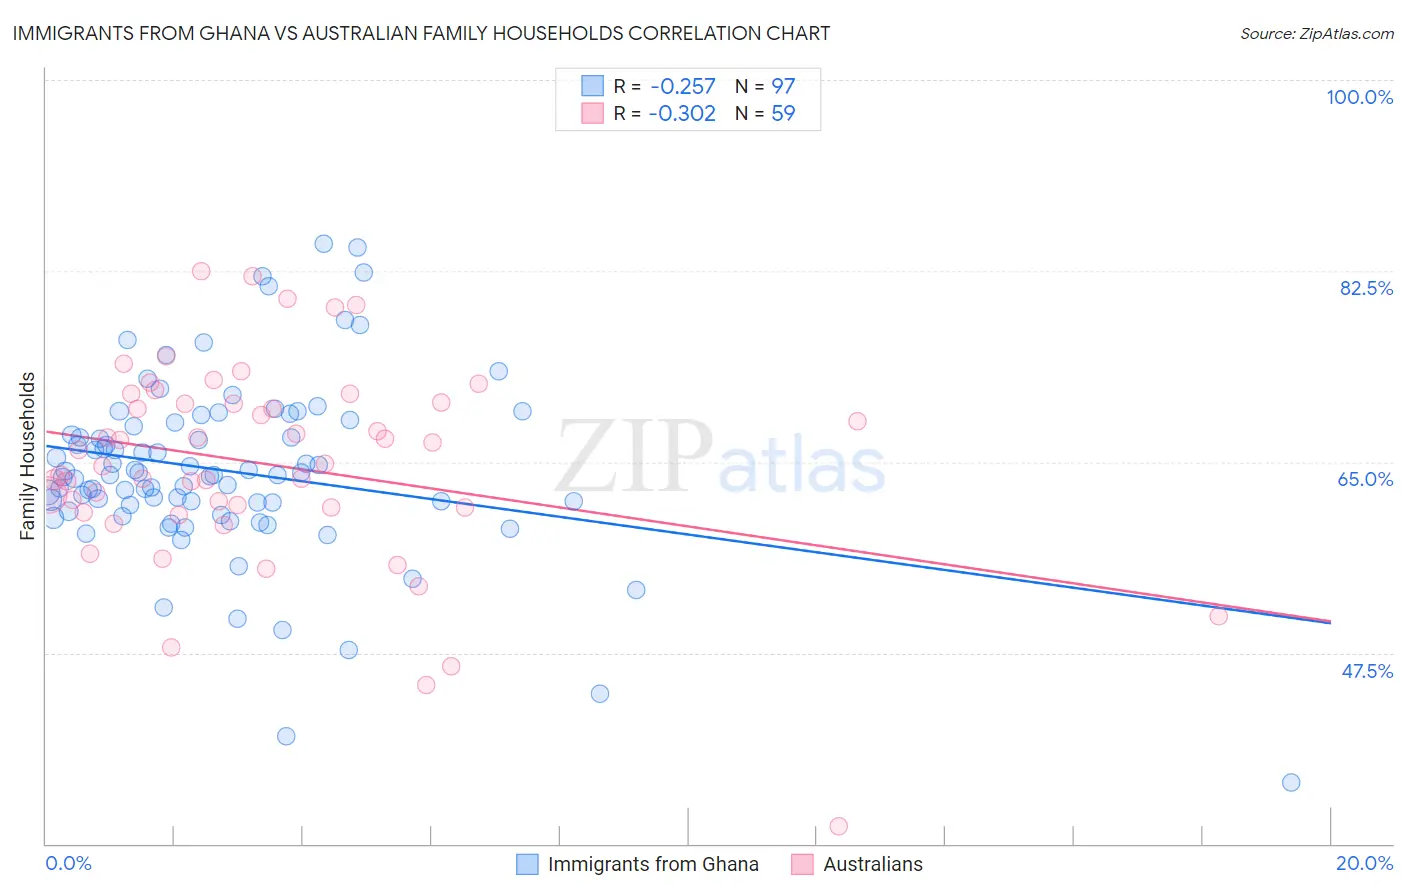
Immigrants from Ghana vs Australian Family Households Correlation Chart
The statistical analysis conducted on geographies consisting of 199,806,163 people shows a weak negative correlation between the proportion of Immigrants from Ghana and percentage of family households in the United States with a correlation coefficient (R) of -0.257 and weighted average of 63.4%. Similarly, the statistical analysis conducted on geographies consisting of 224,034,220 people shows a mild negative correlation between the proportion of Australians and percentage of family households in the United States with a correlation coefficient (R) of -0.302 and weighted average of 62.8%, a difference of 0.89%.
Family Households Correlation Summary
| Measurement | Immigrants from Ghana | Australian |
| Minimum | 35.6% | 31.6% |
| Maximum | 85.0% | 82.4% |
| Range | 49.4% | 50.9% |
| Mean | 64.2% | 64.8% |
| Median | 63.8% | 64.9% |
| Interquartile 25% (IQ1) | 60.8% | 60.9% |
| Interquartile 75% (IQ3) | 68.4% | 70.5% |
| Interquartile Range (IQR) | 7.6% | 9.6% |
| Standard Deviation (Sample) | 8.3% | 9.3% |
| Standard Deviation (Population) | 8.2% | 9.2% |
Similar Demographics by Family Households
Demographics Similar to Immigrants from Ghana by Family Households
In terms of family households, the demographic groups most similar to Immigrants from Ghana are Immigrants from Uzbekistan (63.4%, a difference of 0.010%), Eastern European (63.4%, a difference of 0.020%), Immigrants from Dominica (63.4%, a difference of 0.020%), Dominican (63.4%, a difference of 0.020%), and Russian (63.4%, a difference of 0.030%).
| Demographics | Rating | Rank | Family Households |
| Aleuts | 1.9 /100 | #239 | Tragic 63.4% |
| South Africans | 1.9 /100 | #240 | Tragic 63.4% |
| Immigrants | St. Vincent and the Grenadines | 1.9 /100 | #241 | Tragic 63.4% |
| Immigrants | Israel | 1.8 /100 | #242 | Tragic 63.4% |
| Immigrants | Czechoslovakia | 1.8 /100 | #243 | Tragic 63.4% |
| Eastern Europeans | 1.6 /100 | #244 | Tragic 63.4% |
| Immigrants | Dominica | 1.6 /100 | #245 | Tragic 63.4% |
| Immigrants | Ghana | 1.6 /100 | #246 | Tragic 63.4% |
| Immigrants | Uzbekistan | 1.5 /100 | #247 | Tragic 63.4% |
| Dominicans | 1.5 /100 | #248 | Tragic 63.4% |
| Russians | 1.4 /100 | #249 | Tragic 63.4% |
| Immigrants | Japan | 1.4 /100 | #250 | Tragic 63.4% |
| Taiwanese | 1.2 /100 | #251 | Tragic 63.3% |
| Bahamians | 1.1 /100 | #252 | Tragic 63.3% |
| Immigrants | Dominican Republic | 1.0 /100 | #253 | Tragic 63.3% |
Demographics Similar to Australians by Family Households
In terms of family households, the demographic groups most similar to Australians are Immigrants from Denmark (62.9%, a difference of 0.040%), New Zealander (62.9%, a difference of 0.050%), Estonian (62.9%, a difference of 0.080%), Mongolian (62.8%, a difference of 0.10%), and British West Indian (62.8%, a difference of 0.13%).
| Demographics | Rating | Rank | Family Households |
| Ottawa | 0.3 /100 | #277 | Tragic 63.0% |
| Immigrants | Belgium | 0.2 /100 | #278 | Tragic 63.0% |
| Immigrants | Yemen | 0.2 /100 | #279 | Tragic 63.0% |
| Immigrants | Bulgaria | 0.2 /100 | #280 | Tragic 63.0% |
| Estonians | 0.2 /100 | #281 | Tragic 62.9% |
| New Zealanders | 0.1 /100 | #282 | Tragic 62.9% |
| Immigrants | Denmark | 0.1 /100 | #283 | Tragic 62.9% |
| Australians | 0.1 /100 | #284 | Tragic 62.8% |
| Mongolians | 0.1 /100 | #285 | Tragic 62.8% |
| British West Indians | 0.1 /100 | #286 | Tragic 62.8% |
| Latvians | 0.1 /100 | #287 | Tragic 62.8% |
| Immigrants | Uganda | 0.1 /100 | #288 | Tragic 62.7% |
| Immigrants | Nepal | 0.1 /100 | #289 | Tragic 62.7% |
| Immigrants | Grenada | 0.0 /100 | #290 | Tragic 62.6% |
| U.S. Virgin Islanders | 0.0 /100 | #291 | Tragic 62.6% |