Immigrants from Hong Kong vs Afghan Family Households
COMPARE
Immigrants from Hong Kong
Afghan
Family Households
Family Households Comparison
Immigrants from Hong Kong
Afghans
66.1%
FAMILY HOUSEHOLDS
100.0/ 100
METRIC RATING
56th/ 347
METRIC RANK
66.3%
FAMILY HOUSEHOLDS
100.0/ 100
METRIC RATING
53rd/ 347
METRIC RANK
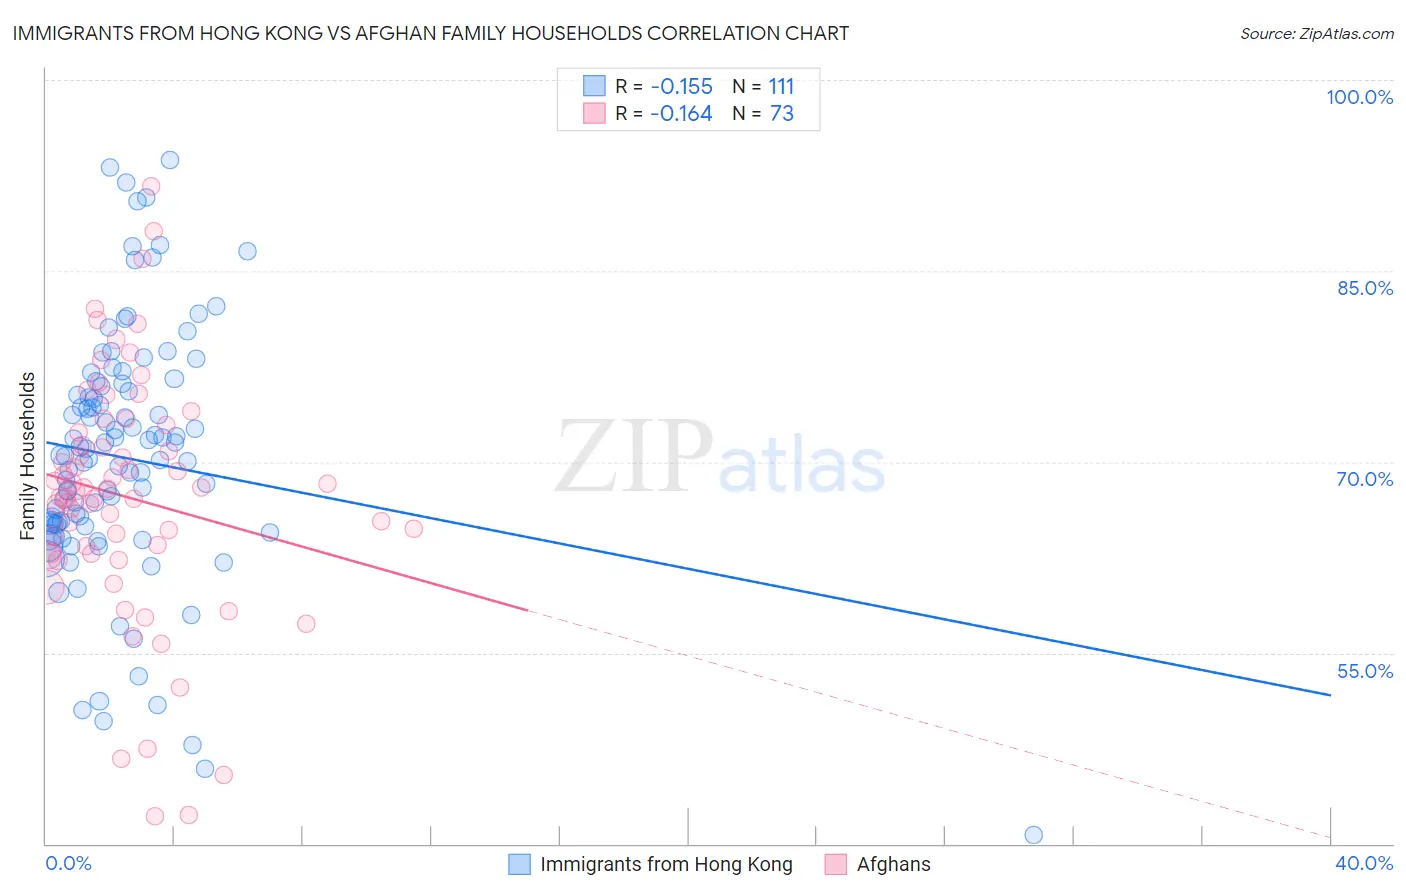
Immigrants from Hong Kong vs Afghan Family Households Correlation Chart
The statistical analysis conducted on geographies consisting of 253,896,995 people shows a poor negative correlation between the proportion of Immigrants from Hong Kong and percentage of family households in the United States with a correlation coefficient (R) of -0.155 and weighted average of 66.1%. Similarly, the statistical analysis conducted on geographies consisting of 148,833,722 people shows a poor negative correlation between the proportion of Afghans and percentage of family households in the United States with a correlation coefficient (R) of -0.164 and weighted average of 66.3%, a difference of 0.18%.
Family Households Correlation Summary
| Measurement | Immigrants from Hong Kong | Afghan |
| Minimum | 40.7% | 42.2% |
| Maximum | 93.8% | 91.7% |
| Range | 53.1% | 49.5% |
| Mean | 70.3% | 67.2% |
| Median | 70.5% | 67.7% |
| Interquartile 25% (IQ1) | 65.1% | 62.8% |
| Interquartile 75% (IQ3) | 75.9% | 72.6% |
| Interquartile Range (IQR) | 10.8% | 9.8% |
| Standard Deviation (Sample) | 9.9% | 9.6% |
| Standard Deviation (Population) | 9.9% | 9.6% |
Demographics Similar to Immigrants from Hong Kong and Afghans by Family Households
In terms of family households, the demographic groups most similar to Immigrants from Hong Kong are Immigrants (66.1%, a difference of 0.010%), Pennsylvania German (66.1%, a difference of 0.020%), Immigrants from Asia (66.1%, a difference of 0.13%), Immigrants from Korea (66.0%, a difference of 0.15%), and South American (66.0%, a difference of 0.15%). Similarly, the demographic groups most similar to Afghans are Immigrants from Colombia (66.3%, a difference of 0.0%), Colombian (66.3%, a difference of 0.010%), Native/Alaskan (66.4%, a difference of 0.14%), Navajo (66.4%, a difference of 0.17%), and Immigrants (66.1%, a difference of 0.17%).
| Demographics | Rating | Rank | Family Households |
| Asians | 100.0 /100 | #44 | Exceptional 66.5% |
| Venezuelans | 100.0 /100 | #45 | Exceptional 66.5% |
| Arapaho | 100.0 /100 | #46 | Exceptional 66.5% |
| Bolivians | 100.0 /100 | #47 | Exceptional 66.5% |
| Immigrants | Venezuela | 100.0 /100 | #48 | Exceptional 66.4% |
| Immigrants | South Central Asia | 100.0 /100 | #49 | Exceptional 66.4% |
| Navajo | 100.0 /100 | #50 | Exceptional 66.4% |
| Natives/Alaskans | 100.0 /100 | #51 | Exceptional 66.4% |
| Colombians | 100.0 /100 | #52 | Exceptional 66.3% |
| Afghans | 100.0 /100 | #53 | Exceptional 66.3% |
| Immigrants | Colombia | 100.0 /100 | #54 | Exceptional 66.3% |
| Immigrants | Immigrants | 100.0 /100 | #55 | Exceptional 66.1% |
| Immigrants | Hong Kong | 100.0 /100 | #56 | Exceptional 66.1% |
| Pennsylvania Germans | 100.0 /100 | #57 | Exceptional 66.1% |
| Immigrants | Asia | 100.0 /100 | #58 | Exceptional 66.1% |
| Immigrants | Korea | 100.0 /100 | #59 | Exceptional 66.0% |
| South Americans | 100.0 /100 | #60 | Exceptional 66.0% |
| Danes | 100.0 /100 | #61 | Exceptional 66.0% |
| Central Americans | 100.0 /100 | #62 | Exceptional 66.0% |
| Immigrants | Indonesia | 100.0 /100 | #63 | Exceptional 66.0% |
| Pima | 99.9 /100 | #64 | Exceptional 65.9% |