Houma vs Afghan Family Households
COMPARE
Houma
Afghan
Family Households
Family Households Comparison
Houma
Afghans
65.7%
FAMILY HOUSEHOLDS
99.9/ 100
METRIC RATING
75th/ 347
METRIC RANK
66.3%
FAMILY HOUSEHOLDS
100.0/ 100
METRIC RATING
53rd/ 347
METRIC RANK
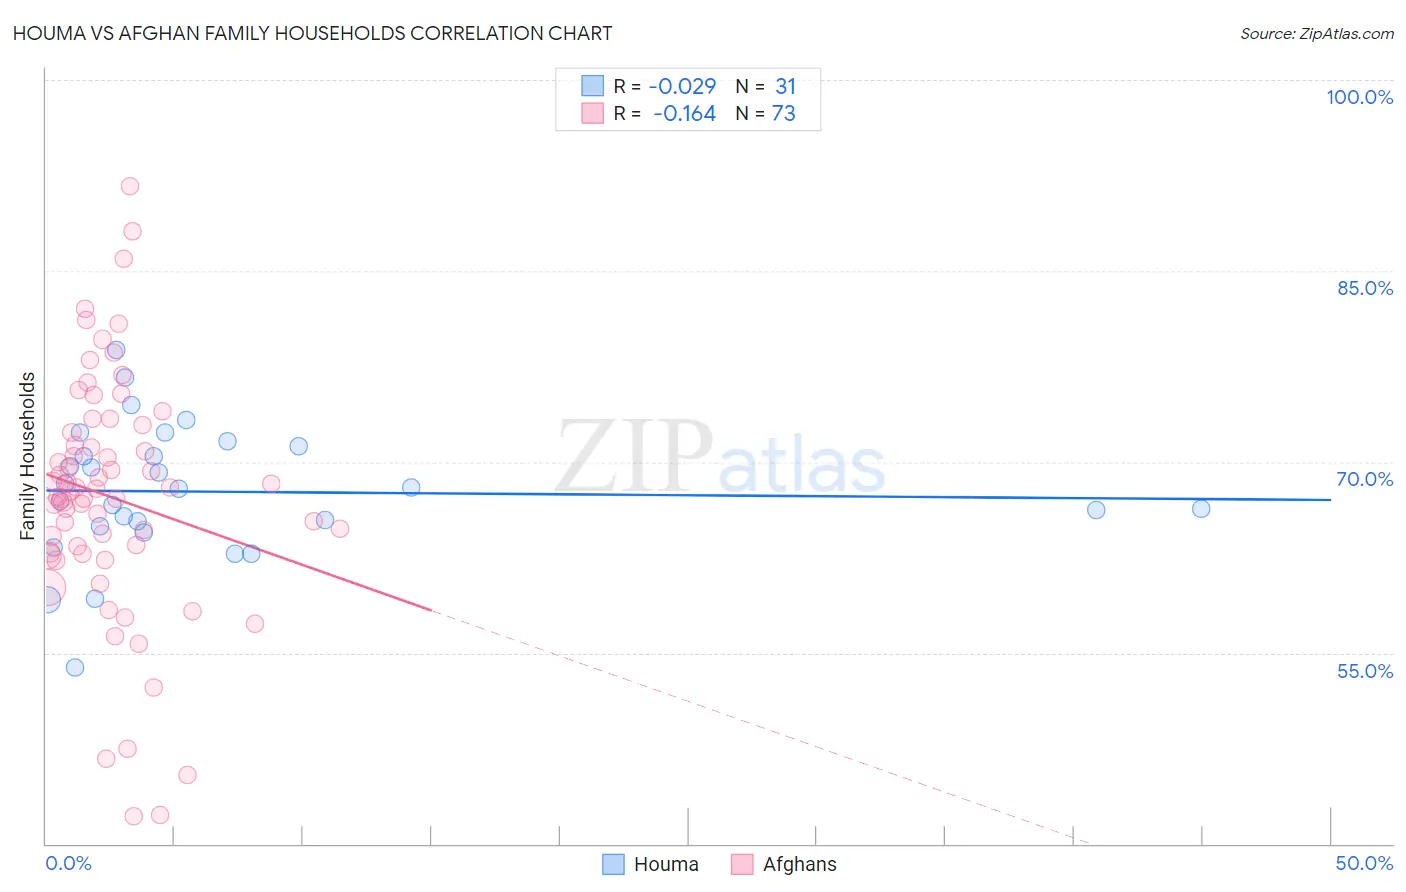
Houma vs Afghan Family Households Correlation Chart
The statistical analysis conducted on geographies consisting of 36,793,599 people shows no correlation between the proportion of Houma and percentage of family households in the United States with a correlation coefficient (R) of -0.029 and weighted average of 65.7%. Similarly, the statistical analysis conducted on geographies consisting of 148,833,722 people shows a poor negative correlation between the proportion of Afghans and percentage of family households in the United States with a correlation coefficient (R) of -0.164 and weighted average of 66.3%, a difference of 0.83%.
Family Households Correlation Summary
| Measurement | Houma | Afghan |
| Minimum | 53.8% | 42.2% |
| Maximum | 78.8% | 91.7% |
| Range | 25.0% | 49.5% |
| Mean | 67.7% | 67.2% |
| Median | 67.8% | 67.7% |
| Interquartile 25% (IQ1) | 65.0% | 62.8% |
| Interquartile 75% (IQ3) | 71.2% | 72.6% |
| Interquartile Range (IQR) | 6.3% | 9.8% |
| Standard Deviation (Sample) | 5.2% | 9.6% |
| Standard Deviation (Population) | 5.1% | 9.6% |
Similar Demographics by Family Households
Demographics Similar to Houma by Family Households
In terms of family households, the demographic groups most similar to Houma are Burmese (65.7%, a difference of 0.050%), Laotian (65.8%, a difference of 0.090%), Immigrants from the Azores (65.6%, a difference of 0.12%), Immigrants from South America (65.6%, a difference of 0.12%), and Yaqui (65.6%, a difference of 0.12%).
| Demographics | Rating | Rank | Family Households |
| Japanese | 99.9 /100 | #68 | Exceptional 65.9% |
| Malaysians | 99.9 /100 | #69 | Exceptional 65.9% |
| Immigrants | Afghanistan | 99.9 /100 | #70 | Exceptional 65.9% |
| Bhutanese | 99.9 /100 | #71 | Exceptional 65.9% |
| Portuguese | 99.9 /100 | #72 | Exceptional 65.8% |
| Laotians | 99.9 /100 | #73 | Exceptional 65.8% |
| Burmese | 99.9 /100 | #74 | Exceptional 65.7% |
| Houma | 99.9 /100 | #75 | Exceptional 65.7% |
| Immigrants | Azores | 99.8 /100 | #76 | Exceptional 65.6% |
| Immigrants | South America | 99.8 /100 | #77 | Exceptional 65.6% |
| Yaqui | 99.8 /100 | #78 | Exceptional 65.6% |
| Immigrants | Costa Rica | 99.8 /100 | #79 | Exceptional 65.6% |
| Puget Sound Salish | 99.8 /100 | #80 | Exceptional 65.6% |
| Jordanians | 99.7 /100 | #81 | Exceptional 65.5% |
| Immigrants | Lebanon | 99.7 /100 | #82 | Exceptional 65.5% |
Demographics Similar to Afghans by Family Households
In terms of family households, the demographic groups most similar to Afghans are Immigrants from Colombia (66.3%, a difference of 0.0%), Colombian (66.3%, a difference of 0.010%), Native/Alaskan (66.4%, a difference of 0.14%), Navajo (66.4%, a difference of 0.17%), and Immigrants (66.1%, a difference of 0.17%).
| Demographics | Rating | Rank | Family Households |
| Arapaho | 100.0 /100 | #46 | Exceptional 66.5% |
| Bolivians | 100.0 /100 | #47 | Exceptional 66.5% |
| Immigrants | Venezuela | 100.0 /100 | #48 | Exceptional 66.4% |
| Immigrants | South Central Asia | 100.0 /100 | #49 | Exceptional 66.4% |
| Navajo | 100.0 /100 | #50 | Exceptional 66.4% |
| Natives/Alaskans | 100.0 /100 | #51 | Exceptional 66.4% |
| Colombians | 100.0 /100 | #52 | Exceptional 66.3% |
| Afghans | 100.0 /100 | #53 | Exceptional 66.3% |
| Immigrants | Colombia | 100.0 /100 | #54 | Exceptional 66.3% |
| Immigrants | Immigrants | 100.0 /100 | #55 | Exceptional 66.1% |
| Immigrants | Hong Kong | 100.0 /100 | #56 | Exceptional 66.1% |
| Pennsylvania Germans | 100.0 /100 | #57 | Exceptional 66.1% |
| Immigrants | Asia | 100.0 /100 | #58 | Exceptional 66.1% |
| Immigrants | Korea | 100.0 /100 | #59 | Exceptional 66.0% |
| South Americans | 100.0 /100 | #60 | Exceptional 66.0% |