Immigrants from Ghana vs Afghan College, 1 year or more
COMPARE
Immigrants from Ghana
Afghan
College, 1 year or more
College, 1 year or more Comparison
Immigrants from Ghana
Afghans
57.4%
COLLEGE, 1 YEAR OR MORE
7.7/ 100
METRIC RATING
221st/ 347
METRIC RANK
62.0%
COLLEGE, 1 YEAR OR MORE
96.4/ 100
METRIC RATING
103rd/ 347
METRIC RANK
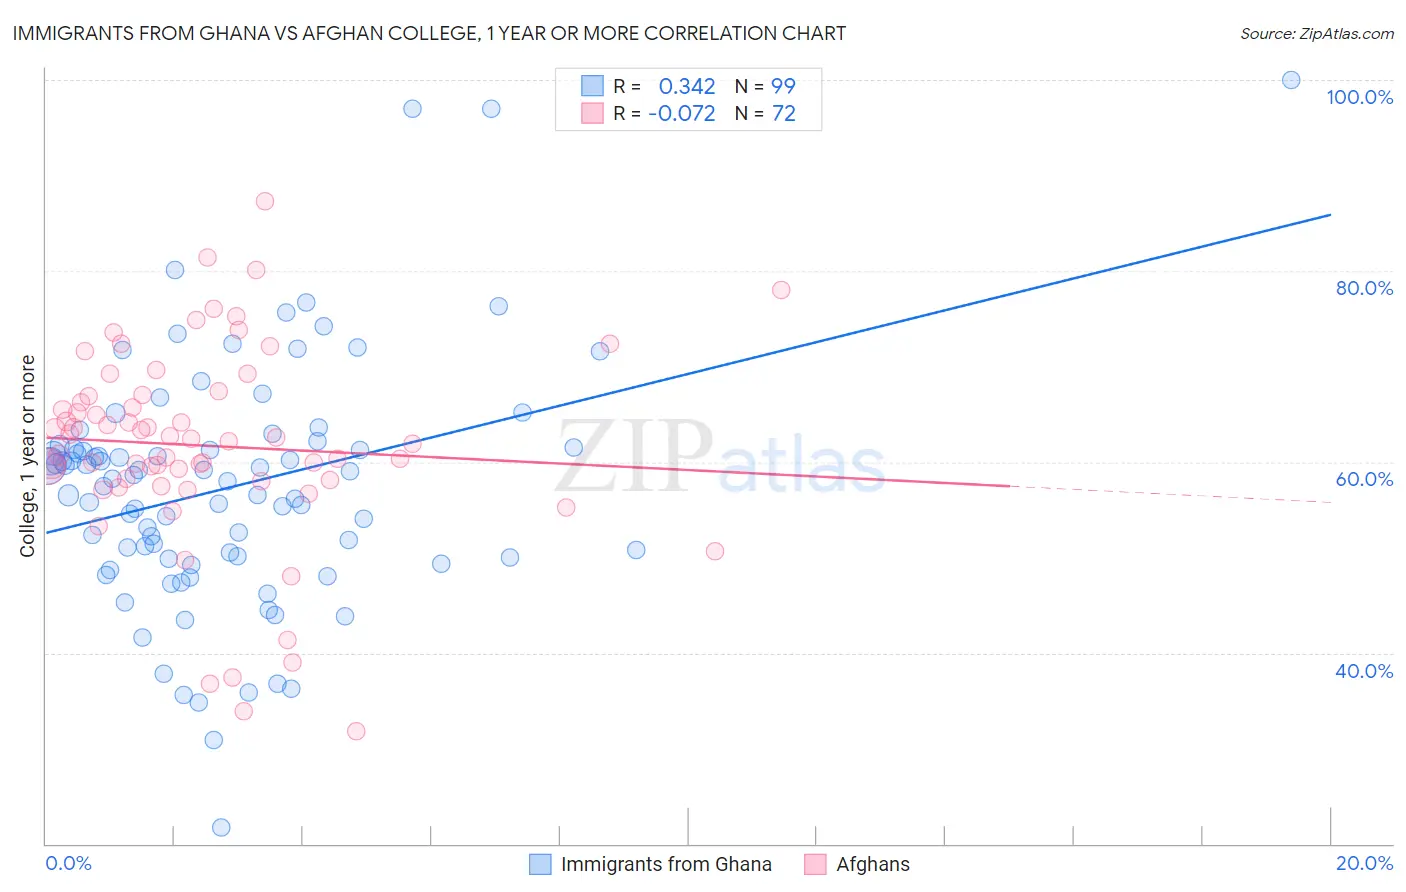
Immigrants from Ghana vs Afghan College, 1 year or more Correlation Chart
The statistical analysis conducted on geographies consisting of 199,951,982 people shows a mild positive correlation between the proportion of Immigrants from Ghana and percentage of population with at least college, 1 year or more education in the United States with a correlation coefficient (R) of 0.342 and weighted average of 57.4%. Similarly, the statistical analysis conducted on geographies consisting of 148,873,328 people shows a slight negative correlation between the proportion of Afghans and percentage of population with at least college, 1 year or more education in the United States with a correlation coefficient (R) of -0.072 and weighted average of 62.0%, a difference of 7.9%.
College, 1 year or more Correlation Summary
| Measurement | Immigrants from Ghana | Afghan |
| Minimum | 21.7% | 31.8% |
| Maximum | 100.0% | 87.2% |
| Range | 78.3% | 55.4% |
| Mean | 57.3% | 61.7% |
| Median | 58.2% | 62.3% |
| Interquartile 25% (IQ1) | 50.0% | 58.0% |
| Interquartile 75% (IQ3) | 61.5% | 67.0% |
| Interquartile Range (IQR) | 11.5% | 8.9% |
| Standard Deviation (Sample) | 12.8% | 10.6% |
| Standard Deviation (Population) | 12.7% | 10.5% |
Similar Demographics by College, 1 year or more
Demographics Similar to Immigrants from Ghana by College, 1 year or more
In terms of college, 1 year or more, the demographic groups most similar to Immigrants from Ghana are Immigrants from Costa Rica (57.5%, a difference of 0.070%), White/Caucasian (57.6%, a difference of 0.19%), Immigrants from Panama (57.6%, a difference of 0.25%), Native Hawaiian (57.6%, a difference of 0.25%), and Subsaharan African (57.3%, a difference of 0.34%).
| Demographics | Rating | Rank | College, 1 year or more |
| Immigrants | Colombia | 11.6 /100 | #214 | Poor 57.8% |
| Tongans | 11.6 /100 | #215 | Poor 57.8% |
| Immigrants | Peru | 10.6 /100 | #216 | Poor 57.7% |
| Immigrants | Panama | 9.1 /100 | #217 | Tragic 57.6% |
| Native Hawaiians | 9.0 /100 | #218 | Tragic 57.6% |
| Whites/Caucasians | 8.7 /100 | #219 | Tragic 57.6% |
| Immigrants | Costa Rica | 8.0 /100 | #220 | Tragic 57.5% |
| Immigrants | Ghana | 7.7 /100 | #221 | Tragic 57.4% |
| Sub-Saharan Africans | 6.1 /100 | #222 | Tragic 57.3% |
| Portuguese | 5.4 /100 | #223 | Tragic 57.2% |
| Hmong | 5.4 /100 | #224 | Tragic 57.2% |
| Vietnamese | 4.7 /100 | #225 | Tragic 57.0% |
| Immigrants | Western Africa | 4.6 /100 | #226 | Tragic 57.0% |
| Immigrants | Immigrants | 4.4 /100 | #227 | Tragic 57.0% |
| Immigrants | Fiji | 4.0 /100 | #228 | Tragic 56.9% |
Demographics Similar to Afghans by College, 1 year or more
In terms of college, 1 year or more, the demographic groups most similar to Afghans are Chilean (62.0%, a difference of 0.010%), Immigrants from Nepal (62.0%, a difference of 0.030%), Palestinian (62.0%, a difference of 0.030%), Luxembourger (62.1%, a difference of 0.12%), and Icelander (62.1%, a difference of 0.13%).
| Demographics | Rating | Rank | College, 1 year or more |
| Chinese | 97.2 /100 | #96 | Exceptional 62.2% |
| Jordanians | 97.2 /100 | #97 | Exceptional 62.2% |
| Carpatho Rusyns | 97.2 /100 | #98 | Exceptional 62.2% |
| Croatians | 97.1 /100 | #99 | Exceptional 62.2% |
| Icelanders | 96.8 /100 | #100 | Exceptional 62.1% |
| Swedes | 96.8 /100 | #101 | Exceptional 62.1% |
| Luxembourgers | 96.7 /100 | #102 | Exceptional 62.1% |
| Afghans | 96.4 /100 | #103 | Exceptional 62.0% |
| Chileans | 96.4 /100 | #104 | Exceptional 62.0% |
| Immigrants | Nepal | 96.3 /100 | #105 | Exceptional 62.0% |
| Palestinians | 96.3 /100 | #106 | Exceptional 62.0% |
| Immigrants | Ukraine | 95.8 /100 | #107 | Exceptional 61.9% |
| Syrians | 95.7 /100 | #108 | Exceptional 61.9% |
| Immigrants | Northern Africa | 95.7 /100 | #109 | Exceptional 61.9% |
| Europeans | 95.6 /100 | #110 | Exceptional 61.8% |