Tsimshian vs Afghan Family Households
COMPARE
Tsimshian
Afghan
Family Households
Family Households Comparison
Tsimshian
Afghans
67.1%
FAMILY HOUSEHOLDS
100.0/ 100
METRIC RATING
37th/ 347
METRIC RANK
66.3%
FAMILY HOUSEHOLDS
100.0/ 100
METRIC RATING
53rd/ 347
METRIC RANK
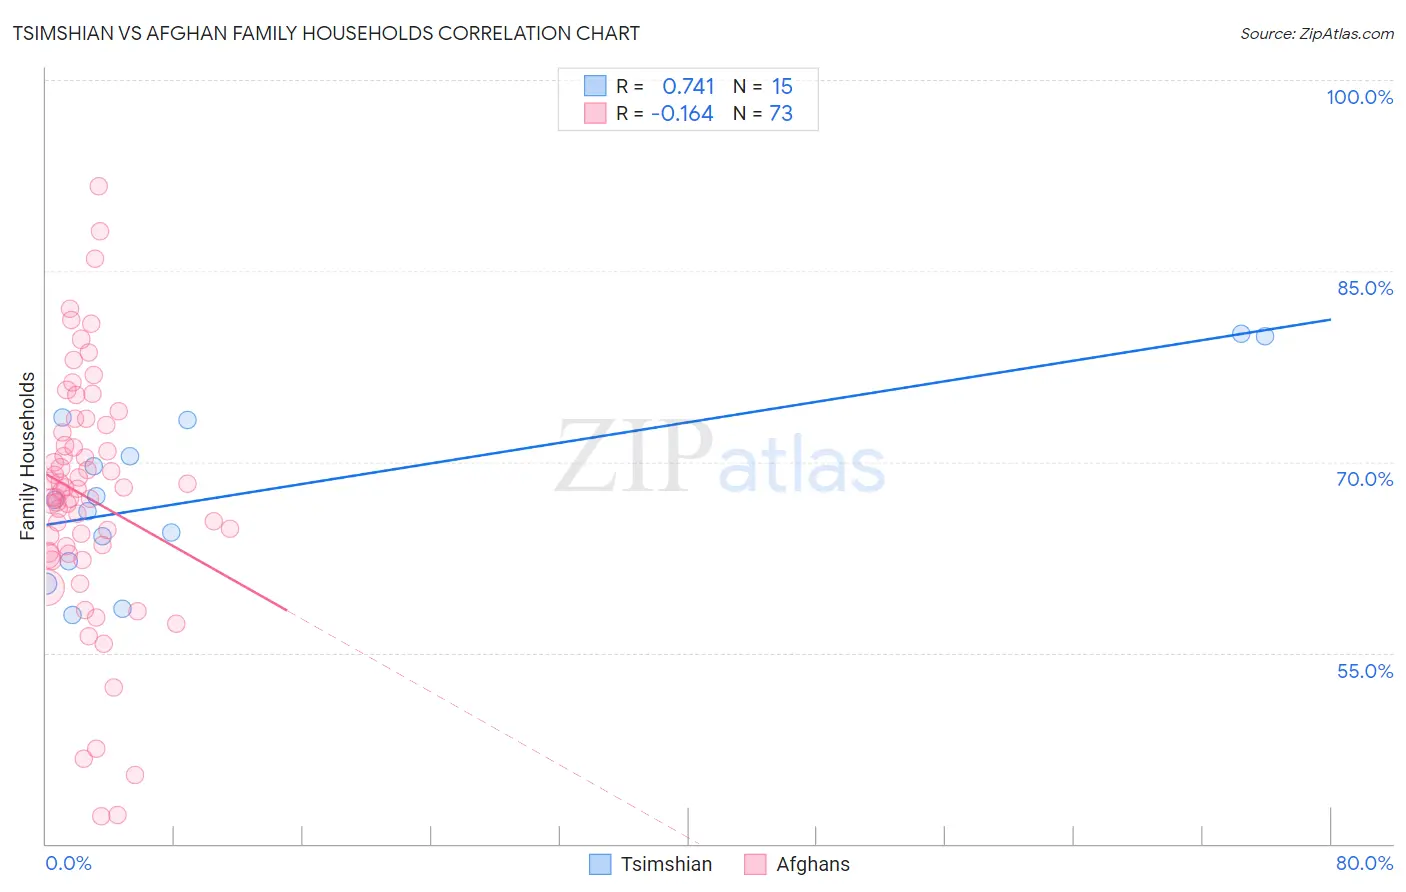
Tsimshian vs Afghan Family Households Correlation Chart
The statistical analysis conducted on geographies consisting of 15,626,544 people shows a strong positive correlation between the proportion of Tsimshian and percentage of family households in the United States with a correlation coefficient (R) of 0.741 and weighted average of 67.1%. Similarly, the statistical analysis conducted on geographies consisting of 148,833,722 people shows a poor negative correlation between the proportion of Afghans and percentage of family households in the United States with a correlation coefficient (R) of -0.164 and weighted average of 66.3%, a difference of 1.2%.
Family Households Correlation Summary
| Measurement | Tsimshian | Afghan |
| Minimum | 58.0% | 42.2% |
| Maximum | 80.1% | 91.7% |
| Range | 22.1% | 49.5% |
| Mean | 67.7% | 67.2% |
| Median | 67.0% | 67.7% |
| Interquartile 25% (IQ1) | 62.2% | 62.8% |
| Interquartile 75% (IQ3) | 73.3% | 72.6% |
| Interquartile Range (IQR) | 11.1% | 9.8% |
| Standard Deviation (Sample) | 6.9% | 9.6% |
| Standard Deviation (Population) | 6.7% | 9.6% |
Demographics Similar to Tsimshian and Afghans by Family Households
In terms of family households, the demographic groups most similar to Tsimshian are Peruvian (67.1%, a difference of 0.070%), Tohono O'odham (67.1%, a difference of 0.080%), Mexican American Indian (67.0%, a difference of 0.10%), Immigrants from El Salvador (67.0%, a difference of 0.12%), and Guamanian/Chamorro (66.6%, a difference of 0.70%). Similarly, the demographic groups most similar to Afghans are Immigrants from Colombia (66.3%, a difference of 0.0%), Colombian (66.3%, a difference of 0.010%), Native/Alaskan (66.4%, a difference of 0.14%), Navajo (66.4%, a difference of 0.17%), and Immigrants (66.1%, a difference of 0.17%).
| Demographics | Rating | Rank | Family Households |
| Tohono O'odham | 100.0 /100 | #35 | Exceptional 67.1% |
| Peruvians | 100.0 /100 | #36 | Exceptional 67.1% |
| Tsimshian | 100.0 /100 | #37 | Exceptional 67.1% |
| Mexican American Indians | 100.0 /100 | #38 | Exceptional 67.0% |
| Immigrants | El Salvador | 100.0 /100 | #39 | Exceptional 67.0% |
| Guamanians/Chamorros | 100.0 /100 | #40 | Exceptional 66.6% |
| Immigrants | Bolivia | 100.0 /100 | #41 | Exceptional 66.6% |
| Menominee | 100.0 /100 | #42 | Exceptional 66.5% |
| Apache | 100.0 /100 | #43 | Exceptional 66.5% |
| Asians | 100.0 /100 | #44 | Exceptional 66.5% |
| Venezuelans | 100.0 /100 | #45 | Exceptional 66.5% |
| Arapaho | 100.0 /100 | #46 | Exceptional 66.5% |
| Bolivians | 100.0 /100 | #47 | Exceptional 66.5% |
| Immigrants | Venezuela | 100.0 /100 | #48 | Exceptional 66.4% |
| Immigrants | South Central Asia | 100.0 /100 | #49 | Exceptional 66.4% |
| Navajo | 100.0 /100 | #50 | Exceptional 66.4% |
| Natives/Alaskans | 100.0 /100 | #51 | Exceptional 66.4% |
| Colombians | 100.0 /100 | #52 | Exceptional 66.3% |
| Afghans | 100.0 /100 | #53 | Exceptional 66.3% |
| Immigrants | Colombia | 100.0 /100 | #54 | Exceptional 66.3% |
| Immigrants | Immigrants | 100.0 /100 | #55 | Exceptional 66.1% |