Immigrants from Germany vs German Russian Average Family Size
COMPARE
Immigrants from Germany
German Russian
Average Family Size
Average Family Size Comparison
Immigrants from Germany
German Russians
3.15
AVERAGE FAMILY SIZE
0.7/ 100
METRIC RATING
271st/ 347
METRIC RANK
3.15
AVERAGE FAMILY SIZE
0.4/ 100
METRIC RATING
283rd/ 347
METRIC RANK
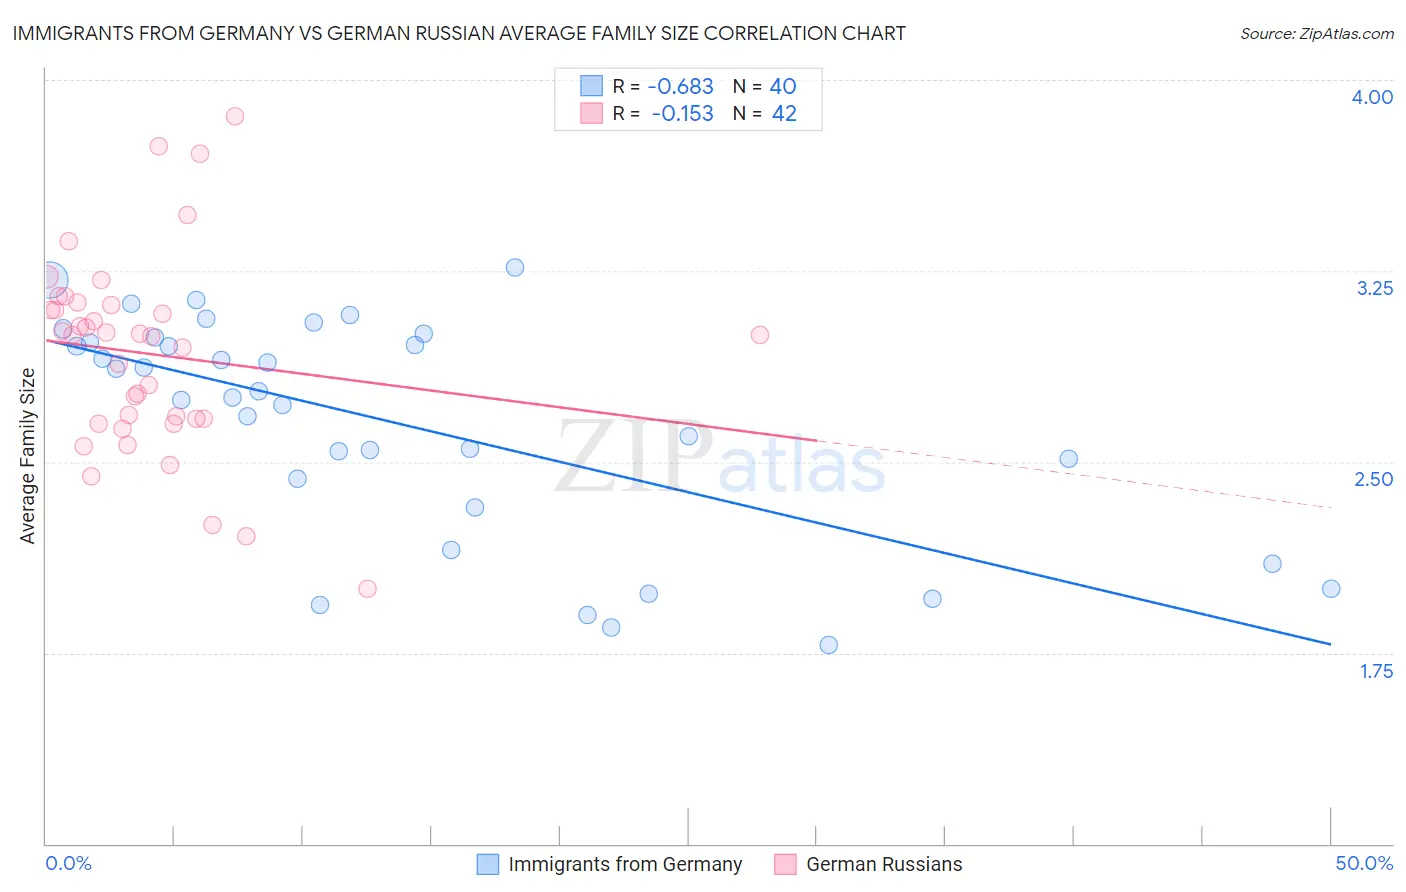
Immigrants from Germany vs German Russian Average Family Size Correlation Chart
The statistical analysis conducted on geographies consisting of 463,759,873 people shows a significant negative correlation between the proportion of Immigrants from Germany and average family size in the United States with a correlation coefficient (R) of -0.683 and weighted average of 3.15. Similarly, the statistical analysis conducted on geographies consisting of 96,451,127 people shows a poor negative correlation between the proportion of German Russians and average family size in the United States with a correlation coefficient (R) of -0.153 and weighted average of 3.15, a difference of 0.26%.
Average Family Size Correlation Summary
| Measurement | Immigrants from Germany | German Russian |
| Minimum | 1.78 | 2.00 |
| Maximum | 3.26 | 3.86 |
| Range | 1.48 | 1.86 |
| Mean | 2.65 | 2.92 |
| Median | 2.77 | 3.00 |
| Interquartile 25% (IQ1) | 2.38 | 2.67 |
| Interquartile 75% (IQ3) | 2.98 | 3.11 |
| Interquartile Range (IQR) | 0.60 | 0.44 |
| Standard Deviation (Sample) | 0.43 | 0.39 |
| Standard Deviation (Population) | 0.43 | 0.38 |
Demographics Similar to Immigrants from Germany and German Russians by Average Family Size
In terms of average family size, the demographic groups most similar to Immigrants from Germany are Tlingit-Haida (3.16, a difference of 0.020%), Immigrants from Lithuania (3.15, a difference of 0.020%), New Zealander (3.15, a difference of 0.030%), Immigrants from Belgium (3.15, a difference of 0.030%), and Cambodian (3.15, a difference of 0.040%). Similarly, the demographic groups most similar to German Russians are Yugoslavian (3.15, a difference of 0.010%), Immigrants from Denmark (3.15, a difference of 0.020%), Immigrants from France (3.15, a difference of 0.020%), Immigrants from England (3.15, a difference of 0.060%), and White/Caucasian (3.14, a difference of 0.070%).
| Demographics | Rating | Rank | Average Family Size |
| Iroquois | 0.8 /100 | #267 | Tragic 3.16 |
| Maltese | 0.8 /100 | #268 | Tragic 3.16 |
| Immigrants | Singapore | 0.7 /100 | #269 | Tragic 3.16 |
| Tlingit-Haida | 0.7 /100 | #270 | Tragic 3.16 |
| Immigrants | Germany | 0.7 /100 | #271 | Tragic 3.15 |
| Immigrants | Lithuania | 0.6 /100 | #272 | Tragic 3.15 |
| New Zealanders | 0.6 /100 | #273 | Tragic 3.15 |
| Immigrants | Belgium | 0.6 /100 | #274 | Tragic 3.15 |
| Cambodians | 0.6 /100 | #275 | Tragic 3.15 |
| Immigrants | Bosnia and Herzegovina | 0.5 /100 | #276 | Tragic 3.15 |
| Swiss | 0.5 /100 | #277 | Tragic 3.15 |
| Okinawans | 0.5 /100 | #278 | Tragic 3.15 |
| Immigrants | Europe | 0.5 /100 | #279 | Tragic 3.15 |
| Immigrants | England | 0.4 /100 | #280 | Tragic 3.15 |
| Immigrants | Denmark | 0.4 /100 | #281 | Tragic 3.15 |
| Yugoslavians | 0.4 /100 | #282 | Tragic 3.15 |
| German Russians | 0.4 /100 | #283 | Tragic 3.15 |
| Immigrants | France | 0.4 /100 | #284 | Tragic 3.15 |
| Whites/Caucasians | 0.3 /100 | #285 | Tragic 3.14 |
| Immigrants | Netherlands | 0.3 /100 | #286 | Tragic 3.14 |
| Greeks | 0.3 /100 | #287 | Tragic 3.14 |