Immigrants from Germany vs Panamanian Female Poverty
COMPARE
Immigrants from Germany
Panamanian
Female Poverty
Female Poverty Comparison
Immigrants from Germany
Panamanians
13.1%
FEMALE POVERTY
74.9/ 100
METRIC RATING
151st/ 347
METRIC RANK
14.2%
FEMALE POVERTY
7.7/ 100
METRIC RATING
209th/ 347
METRIC RANK
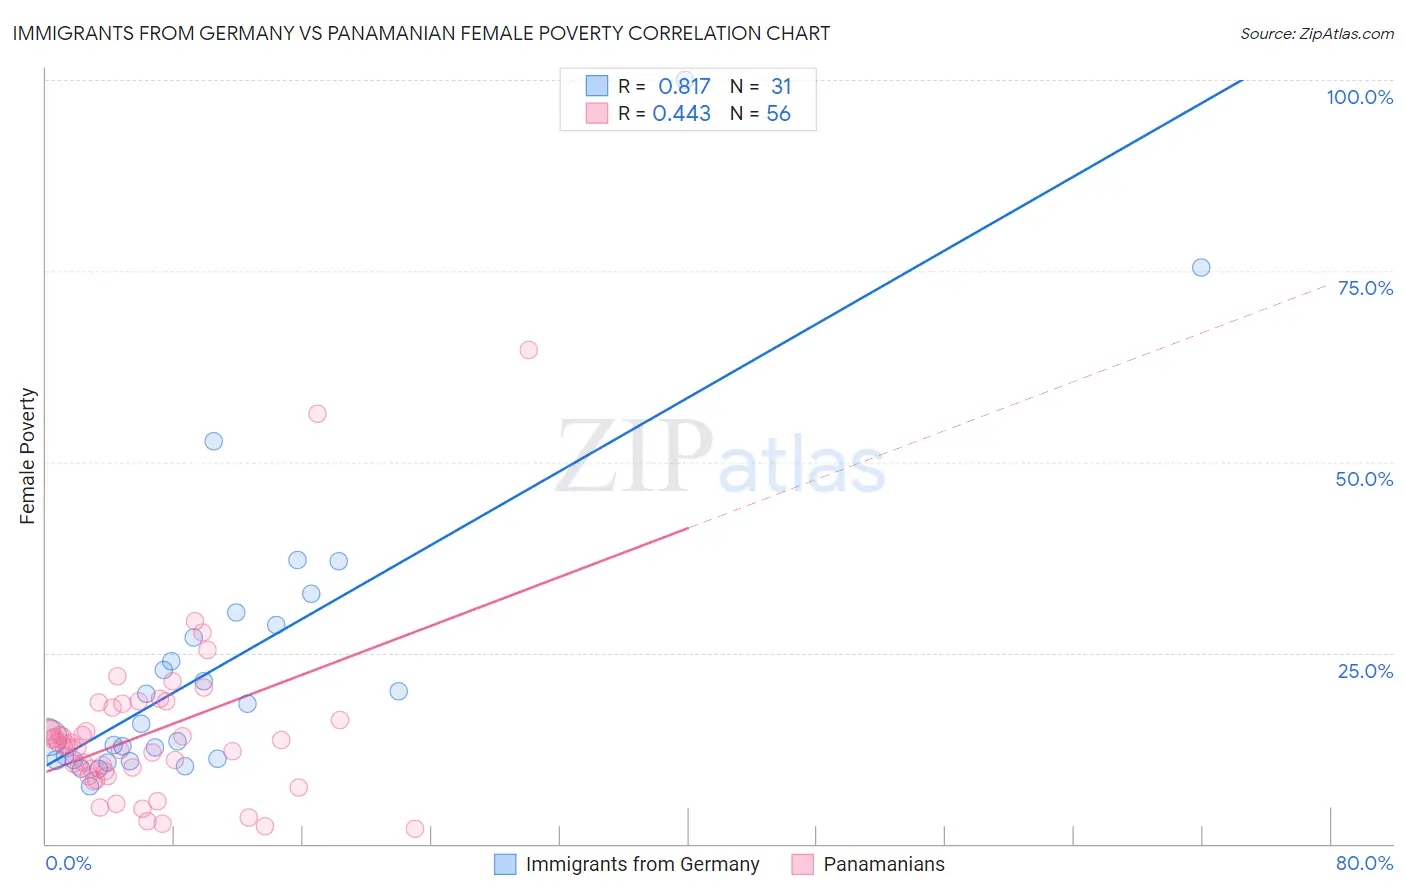
Immigrants from Germany vs Panamanian Female Poverty Correlation Chart
The statistical analysis conducted on geographies consisting of 463,610,140 people shows a very strong positive correlation between the proportion of Immigrants from Germany and poverty level among females in the United States with a correlation coefficient (R) of 0.817 and weighted average of 13.1%. Similarly, the statistical analysis conducted on geographies consisting of 281,053,413 people shows a moderate positive correlation between the proportion of Panamanians and poverty level among females in the United States with a correlation coefficient (R) of 0.443 and weighted average of 14.2%, a difference of 8.8%.
Female Poverty Correlation Summary
| Measurement | Immigrants from Germany | Panamanian |
| Minimum | 7.5% | 1.9% |
| Maximum | 100.0% | 64.6% |
| Range | 92.5% | 62.7% |
| Mean | 23.6% | 14.4% |
| Median | 15.7% | 12.9% |
| Interquartile 25% (IQ1) | 10.9% | 9.2% |
| Interquartile 75% (IQ3) | 28.6% | 17.0% |
| Interquartile Range (IQR) | 17.6% | 7.8% |
| Standard Deviation (Sample) | 20.3% | 10.8% |
| Standard Deviation (Population) | 20.0% | 10.7% |
Similar Demographics by Female Poverty
Demographics Similar to Immigrants from Germany by Female Poverty
In terms of female poverty, the demographic groups most similar to Immigrants from Germany are Tsimshian (13.1%, a difference of 0.070%), Taiwanese (13.1%, a difference of 0.10%), Samoan (13.1%, a difference of 0.17%), Yugoslavian (13.1%, a difference of 0.26%), and Immigrants from Fiji (13.2%, a difference of 0.49%).
| Demographics | Rating | Rank | Female Poverty |
| Afghans | 79.8 /100 | #144 | Good 13.0% |
| Syrians | 79.6 /100 | #145 | Good 13.0% |
| Immigrants | Peru | 79.1 /100 | #146 | Good 13.0% |
| Immigrants | Kazakhstan | 78.6 /100 | #147 | Good 13.0% |
| Yugoslavians | 76.9 /100 | #148 | Good 13.1% |
| Taiwanese | 75.7 /100 | #149 | Good 13.1% |
| Tsimshian | 75.5 /100 | #150 | Good 13.1% |
| Immigrants | Germany | 74.9 /100 | #151 | Good 13.1% |
| Samoans | 73.6 /100 | #152 | Good 13.1% |
| Immigrants | Fiji | 71.0 /100 | #153 | Good 13.2% |
| Armenians | 70.4 /100 | #154 | Good 13.2% |
| Hungarians | 70.1 /100 | #155 | Good 13.2% |
| Immigrants | Bosnia and Herzegovina | 69.7 /100 | #156 | Good 13.2% |
| Immigrants | Northern Africa | 68.8 /100 | #157 | Good 13.2% |
| Pennsylvania Germans | 67.3 /100 | #158 | Good 13.2% |
Demographics Similar to Panamanians by Female Poverty
In terms of female poverty, the demographic groups most similar to Panamanians are Immigrants from the Azores (14.2%, a difference of 0.060%), Malaysian (14.3%, a difference of 0.080%), Moroccan (14.3%, a difference of 0.17%), Immigrants from Eastern Africa (14.2%, a difference of 0.41%), and Bermudan (14.4%, a difference of 0.80%).
| Demographics | Rating | Rank | Female Poverty |
| Hmong | 21.1 /100 | #202 | Fair 13.9% |
| Immigrants | Western Asia | 20.7 /100 | #203 | Fair 13.9% |
| Spaniards | 18.9 /100 | #204 | Poor 13.9% |
| Ugandans | 15.4 /100 | #205 | Poor 14.0% |
| Immigrants | Uruguay | 14.0 /100 | #206 | Poor 14.0% |
| Immigrants | Eastern Africa | 9.0 /100 | #207 | Tragic 14.2% |
| Immigrants | Azores | 7.9 /100 | #208 | Tragic 14.2% |
| Panamanians | 7.7 /100 | #209 | Tragic 14.2% |
| Malaysians | 7.4 /100 | #210 | Tragic 14.3% |
| Moroccans | 7.2 /100 | #211 | Tragic 14.3% |
| Bermudans | 5.5 /100 | #212 | Tragic 14.4% |
| Alaskan Athabascans | 5.3 /100 | #213 | Tragic 14.4% |
| Marshallese | 5.0 /100 | #214 | Tragic 14.4% |
| Immigrants | Panama | 4.7 /100 | #215 | Tragic 14.4% |
| Immigrants | Thailand | 4.5 /100 | #216 | Tragic 14.4% |