Immigrants from Germany vs Panamanian Bachelor's Degree
COMPARE
Immigrants from Germany
Panamanian
Bachelor's Degree
Bachelor's Degree Comparison
Immigrants from Germany
Panamanians
38.6%
BACHELOR'S DEGREE
69.6/ 100
METRIC RATING
158th/ 347
METRIC RANK
36.5%
BACHELOR'S DEGREE
18.8/ 100
METRIC RATING
209th/ 347
METRIC RANK
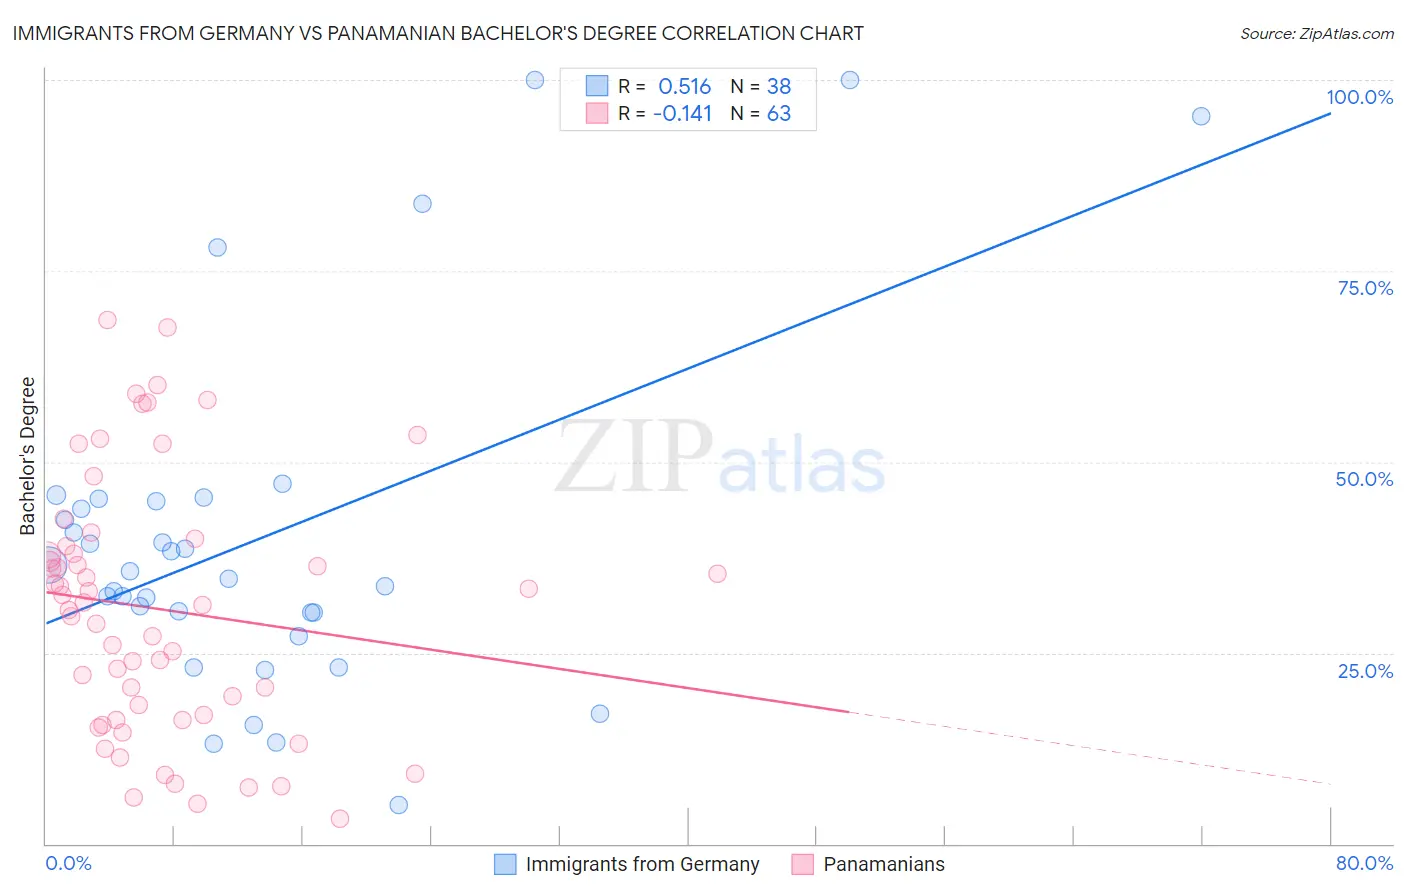
Immigrants from Germany vs Panamanian Bachelor's Degree Correlation Chart
The statistical analysis conducted on geographies consisting of 463,864,654 people shows a substantial positive correlation between the proportion of Immigrants from Germany and percentage of population with at least bachelor's degree education in the United States with a correlation coefficient (R) of 0.516 and weighted average of 38.6%. Similarly, the statistical analysis conducted on geographies consisting of 281,235,018 people shows a poor negative correlation between the proportion of Panamanians and percentage of population with at least bachelor's degree education in the United States with a correlation coefficient (R) of -0.141 and weighted average of 36.5%, a difference of 5.8%.
Bachelor's Degree Correlation Summary
| Measurement | Immigrants from Germany | Panamanian |
| Minimum | 5.1% | 3.2% |
| Maximum | 100.0% | 68.6% |
| Range | 94.9% | 65.4% |
| Mean | 40.0% | 30.7% |
| Median | 35.2% | 31.3% |
| Interquartile 25% (IQ1) | 30.3% | 16.2% |
| Interquartile 75% (IQ3) | 44.9% | 38.9% |
| Interquartile Range (IQR) | 14.6% | 22.7% |
| Standard Deviation (Sample) | 22.8% | 16.7% |
| Standard Deviation (Population) | 22.5% | 16.6% |
Similar Demographics by Bachelor's Degree
Demographics Similar to Immigrants from Germany by Bachelor's Degree
In terms of bachelor's degree, the demographic groups most similar to Immigrants from Germany are Immigrants from South America (38.6%, a difference of 0.060%), Chinese (38.5%, a difference of 0.33%), Vietnamese (38.5%, a difference of 0.33%), Kenyan (38.7%, a difference of 0.34%), and Uruguayan (38.4%, a difference of 0.42%).
| Demographics | Rating | Rank | Bachelor's Degree |
| Immigrants | Africa | 76.5 /100 | #151 | Good 38.9% |
| Sudanese | 76.4 /100 | #152 | Good 38.9% |
| Slavs | 75.9 /100 | #153 | Good 38.9% |
| Canadians | 75.0 /100 | #154 | Good 38.8% |
| Immigrants | Kenya | 73.8 /100 | #155 | Good 38.8% |
| Kenyans | 72.5 /100 | #156 | Good 38.7% |
| Immigrants | South America | 70.1 /100 | #157 | Good 38.6% |
| Immigrants | Germany | 69.6 /100 | #158 | Good 38.6% |
| Chinese | 66.6 /100 | #159 | Good 38.5% |
| Vietnamese | 66.6 /100 | #160 | Good 38.5% |
| Uruguayans | 65.8 /100 | #161 | Good 38.4% |
| Colombians | 65.0 /100 | #162 | Good 38.4% |
| Peruvians | 63.4 /100 | #163 | Good 38.3% |
| Hungarians | 62.1 /100 | #164 | Good 38.3% |
| Sri Lankans | 59.1 /100 | #165 | Average 38.2% |
Demographics Similar to Panamanians by Bachelor's Degree
In terms of bachelor's degree, the demographic groups most similar to Panamanians are French (36.5%, a difference of 0.030%), Scotch-Irish (36.4%, a difference of 0.080%), Immigrants from Thailand (36.5%, a difference of 0.10%), Immigrants from Philippines (36.4%, a difference of 0.16%), and Immigrants from Middle Africa (36.6%, a difference of 0.30%).
| Demographics | Rating | Rank | Bachelor's Degree |
| Immigrants | Zaire | 25.3 /100 | #202 | Fair 36.8% |
| Immigrants | Nigeria | 23.1 /100 | #203 | Fair 36.7% |
| Immigrants | Immigrants | 22.8 /100 | #204 | Fair 36.7% |
| Finns | 22.2 /100 | #205 | Fair 36.7% |
| Spaniards | 21.2 /100 | #206 | Fair 36.6% |
| Immigrants | Middle Africa | 20.6 /100 | #207 | Fair 36.6% |
| Immigrants | Thailand | 19.4 /100 | #208 | Poor 36.5% |
| Panamanians | 18.8 /100 | #209 | Poor 36.5% |
| French | 18.6 /100 | #210 | Poor 36.5% |
| Scotch-Irish | 18.3 /100 | #211 | Poor 36.4% |
| Immigrants | Philippines | 17.8 /100 | #212 | Poor 36.4% |
| Immigrants | Panama | 14.2 /100 | #213 | Poor 36.2% |
| Germans | 13.9 /100 | #214 | Poor 36.1% |
| Immigrants | Western Africa | 13.8 /100 | #215 | Poor 36.1% |
| Barbadians | 13.5 /100 | #216 | Poor 36.1% |