Immigrants from Germany vs Alsatian Average Family Size
COMPARE
Immigrants from Germany
Alsatian
Average Family Size
Average Family Size Comparison
Immigrants from Germany
Alsatians
3.15
AVERAGE FAMILY SIZE
0.7/ 100
METRIC RATING
271st/ 347
METRIC RANK
3.14
AVERAGE FAMILY SIZE
0.2/ 100
METRIC RATING
291st/ 347
METRIC RANK
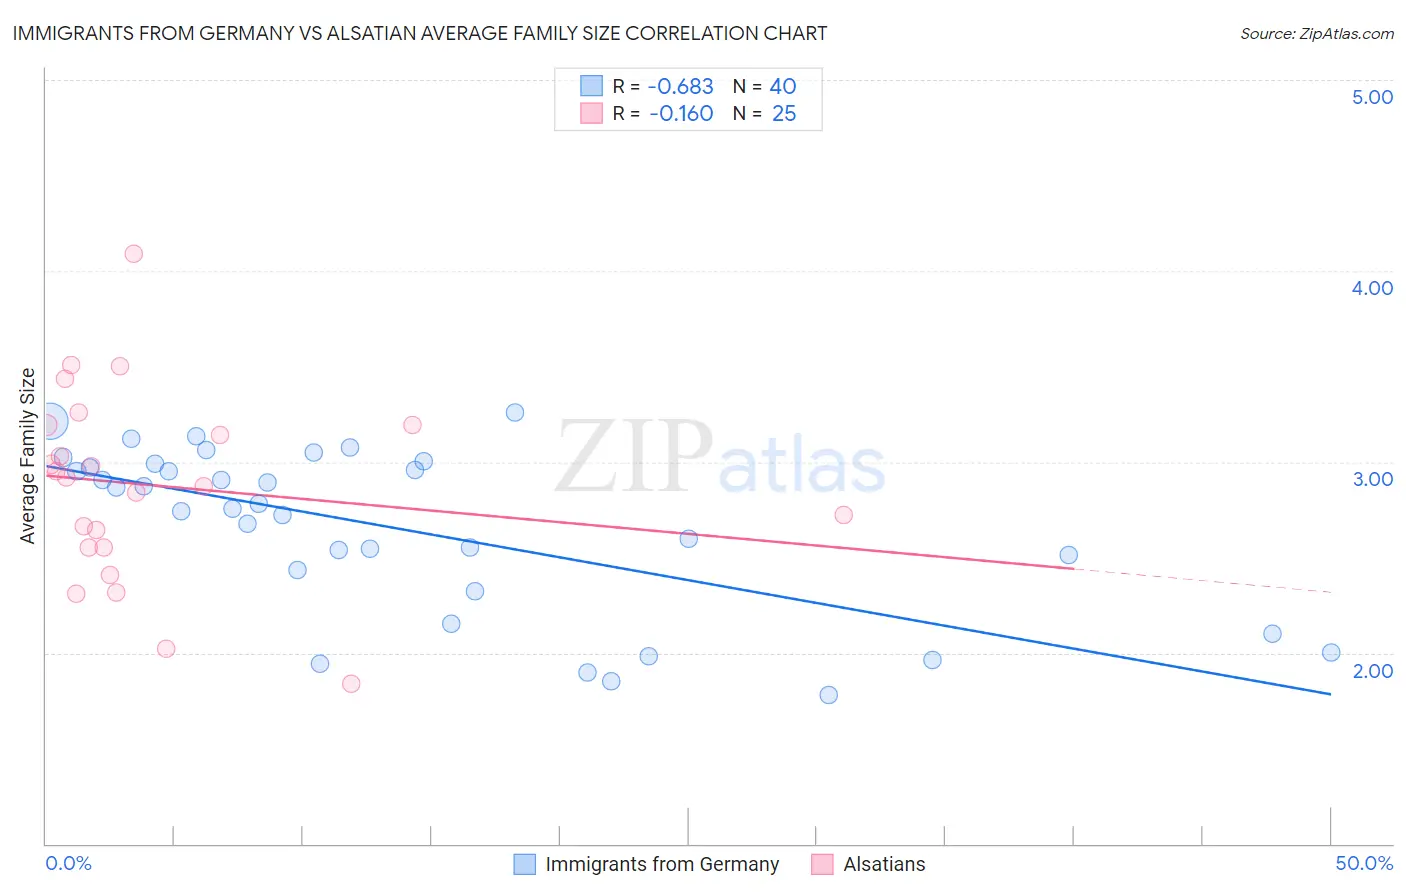
Immigrants from Germany vs Alsatian Average Family Size Correlation Chart
The statistical analysis conducted on geographies consisting of 463,759,873 people shows a significant negative correlation between the proportion of Immigrants from Germany and average family size in the United States with a correlation coefficient (R) of -0.683 and weighted average of 3.15. Similarly, the statistical analysis conducted on geographies consisting of 82,680,020 people shows a poor negative correlation between the proportion of Alsatians and average family size in the United States with a correlation coefficient (R) of -0.160 and weighted average of 3.14, a difference of 0.47%.
Average Family Size Correlation Summary
| Measurement | Immigrants from Germany | Alsatian |
| Minimum | 1.78 | 1.84 |
| Maximum | 3.26 | 4.09 |
| Range | 1.48 | 2.25 |
| Mean | 2.65 | 2.88 |
| Median | 2.77 | 2.92 |
| Interquartile 25% (IQ1) | 2.38 | 2.55 |
| Interquartile 75% (IQ3) | 2.98 | 3.19 |
| Interquartile Range (IQR) | 0.60 | 0.64 |
| Standard Deviation (Sample) | 0.43 | 0.50 |
| Standard Deviation (Population) | 0.43 | 0.49 |
Demographics Similar to Immigrants from Germany and Alsatians by Average Family Size
In terms of average family size, the demographic groups most similar to Immigrants from Germany are Immigrants from Lithuania (3.15, a difference of 0.020%), New Zealander (3.15, a difference of 0.030%), Immigrants from Belgium (3.15, a difference of 0.030%), Cambodian (3.15, a difference of 0.040%), and Immigrants from Bosnia and Herzegovina (3.15, a difference of 0.12%). Similarly, the demographic groups most similar to Alsatians are Cypriot (3.14, a difference of 0.040%), Greek (3.14, a difference of 0.070%), Immigrants from Czechoslovakia (3.14, a difference of 0.070%), Immigrants from Norway (3.14, a difference of 0.070%), and Immigrants from Netherlands (3.14, a difference of 0.080%).
| Demographics | Rating | Rank | Average Family Size |
| Immigrants | Germany | 0.7 /100 | #271 | Tragic 3.15 |
| Immigrants | Lithuania | 0.6 /100 | #272 | Tragic 3.15 |
| New Zealanders | 0.6 /100 | #273 | Tragic 3.15 |
| Immigrants | Belgium | 0.6 /100 | #274 | Tragic 3.15 |
| Cambodians | 0.6 /100 | #275 | Tragic 3.15 |
| Immigrants | Bosnia and Herzegovina | 0.5 /100 | #276 | Tragic 3.15 |
| Swiss | 0.5 /100 | #277 | Tragic 3.15 |
| Okinawans | 0.5 /100 | #278 | Tragic 3.15 |
| Immigrants | Europe | 0.5 /100 | #279 | Tragic 3.15 |
| Immigrants | England | 0.4 /100 | #280 | Tragic 3.15 |
| Immigrants | Denmark | 0.4 /100 | #281 | Tragic 3.15 |
| Yugoslavians | 0.4 /100 | #282 | Tragic 3.15 |
| German Russians | 0.4 /100 | #283 | Tragic 3.15 |
| Immigrants | France | 0.4 /100 | #284 | Tragic 3.15 |
| Whites/Caucasians | 0.3 /100 | #285 | Tragic 3.14 |
| Immigrants | Netherlands | 0.3 /100 | #286 | Tragic 3.14 |
| Greeks | 0.3 /100 | #287 | Tragic 3.14 |
| Immigrants | Czechoslovakia | 0.3 /100 | #288 | Tragic 3.14 |
| Immigrants | Norway | 0.3 /100 | #289 | Tragic 3.14 |
| Cypriots | 0.3 /100 | #290 | Tragic 3.14 |
| Alsatians | 0.2 /100 | #291 | Tragic 3.14 |