Immigrants from Ethiopia vs Cape Verdean Family Households
COMPARE
Immigrants from Ethiopia
Cape Verdean
Family Households
Family Households Comparison
Immigrants from Ethiopia
Cape Verdeans
61.2%
FAMILY HOUSEHOLDS
0.0/ 100
METRIC RATING
333rd/ 347
METRIC RANK
61.8%
FAMILY HOUSEHOLDS
0.0/ 100
METRIC RATING
319th/ 347
METRIC RANK
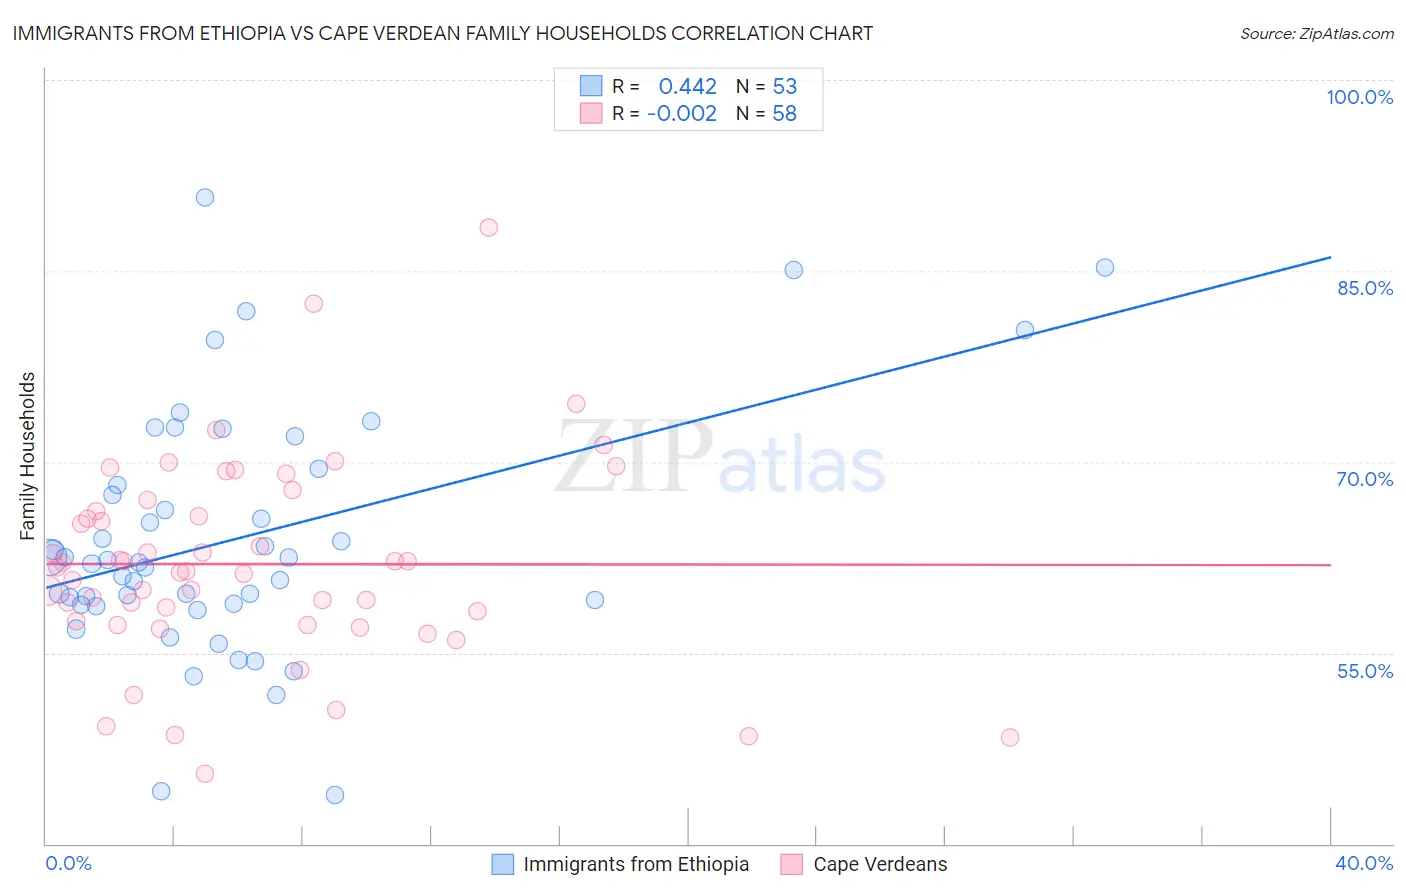
Immigrants from Ethiopia vs Cape Verdean Family Households Correlation Chart
The statistical analysis conducted on geographies consisting of 211,469,180 people shows a moderate positive correlation between the proportion of Immigrants from Ethiopia and percentage of family households in the United States with a correlation coefficient (R) of 0.442 and weighted average of 61.2%. Similarly, the statistical analysis conducted on geographies consisting of 107,550,283 people shows no correlation between the proportion of Cape Verdeans and percentage of family households in the United States with a correlation coefficient (R) of -0.002 and weighted average of 61.8%, a difference of 0.95%.
Family Households Correlation Summary
| Measurement | Immigrants from Ethiopia | Cape Verdean |
| Minimum | 43.8% | 45.5% |
| Maximum | 90.8% | 88.4% |
| Range | 47.0% | 42.9% |
| Mean | 63.9% | 62.0% |
| Median | 62.1% | 61.5% |
| Interquartile 25% (IQ1) | 58.8% | 57.5% |
| Interquartile 75% (IQ3) | 68.8% | 66.1% |
| Interquartile Range (IQR) | 10.0% | 8.6% |
| Standard Deviation (Sample) | 9.6% | 7.9% |
| Standard Deviation (Population) | 9.6% | 7.8% |
Demographics Similar to Immigrants from Ethiopia and Cape Verdeans by Family Households
In terms of family households, the demographic groups most similar to Immigrants from Ethiopia are Ethiopian (61.2%, a difference of 0.080%), Immigrants from Eastern Africa (61.1%, a difference of 0.080%), Immigrants from Australia (61.3%, a difference of 0.16%), Immigrants from France (61.3%, a difference of 0.16%), and Carpatho Rusyn (61.1%, a difference of 0.20%). Similarly, the demographic groups most similar to Cape Verdeans are Alaskan Athabascan (61.8%, a difference of 0.060%), Ugandan (61.7%, a difference of 0.12%), Immigrants from Bosnia and Herzegovina (61.9%, a difference of 0.14%), Alsatian (61.7%, a difference of 0.17%), and Immigrants from Middle Africa (61.9%, a difference of 0.18%).
| Demographics | Rating | Rank | Family Households |
| Immigrants | Middle Africa | 0.0 /100 | #316 | Tragic 61.9% |
| Immigrants | Bosnia and Herzegovina | 0.0 /100 | #317 | Tragic 61.9% |
| Alaskan Athabascans | 0.0 /100 | #318 | Tragic 61.8% |
| Cape Verdeans | 0.0 /100 | #319 | Tragic 61.8% |
| Ugandans | 0.0 /100 | #320 | Tragic 61.7% |
| Alsatians | 0.0 /100 | #321 | Tragic 61.7% |
| Immigrants | Serbia | 0.0 /100 | #322 | Tragic 61.6% |
| Tlingit-Haida | 0.0 /100 | #323 | Tragic 61.6% |
| Immigrants | West Indies | 0.0 /100 | #324 | Tragic 61.6% |
| Immigrants | Switzerland | 0.0 /100 | #325 | Tragic 61.6% |
| Indonesians | 0.0 /100 | #326 | Tragic 61.5% |
| Blacks/African Americans | 0.0 /100 | #327 | Tragic 61.5% |
| Kiowa | 0.0 /100 | #328 | Tragic 61.4% |
| Cambodians | 0.0 /100 | #329 | Tragic 61.4% |
| Immigrants | Australia | 0.0 /100 | #330 | Tragic 61.3% |
| Immigrants | France | 0.0 /100 | #331 | Tragic 61.3% |
| Ethiopians | 0.0 /100 | #332 | Tragic 61.2% |
| Immigrants | Ethiopia | 0.0 /100 | #333 | Tragic 61.2% |
| Immigrants | Eastern Africa | 0.0 /100 | #334 | Tragic 61.1% |
| Carpatho Rusyns | 0.0 /100 | #335 | Tragic 61.1% |
| German Russians | 0.0 /100 | #336 | Tragic 60.9% |