Immigrants from Eastern Africa vs Cape Verdean Family Households
COMPARE
Immigrants from Eastern Africa
Cape Verdean
Family Households
Family Households Comparison
Immigrants from Eastern Africa
Cape Verdeans
61.1%
FAMILY HOUSEHOLDS
0.0/ 100
METRIC RATING
334th/ 347
METRIC RANK
61.8%
FAMILY HOUSEHOLDS
0.0/ 100
METRIC RATING
319th/ 347
METRIC RANK
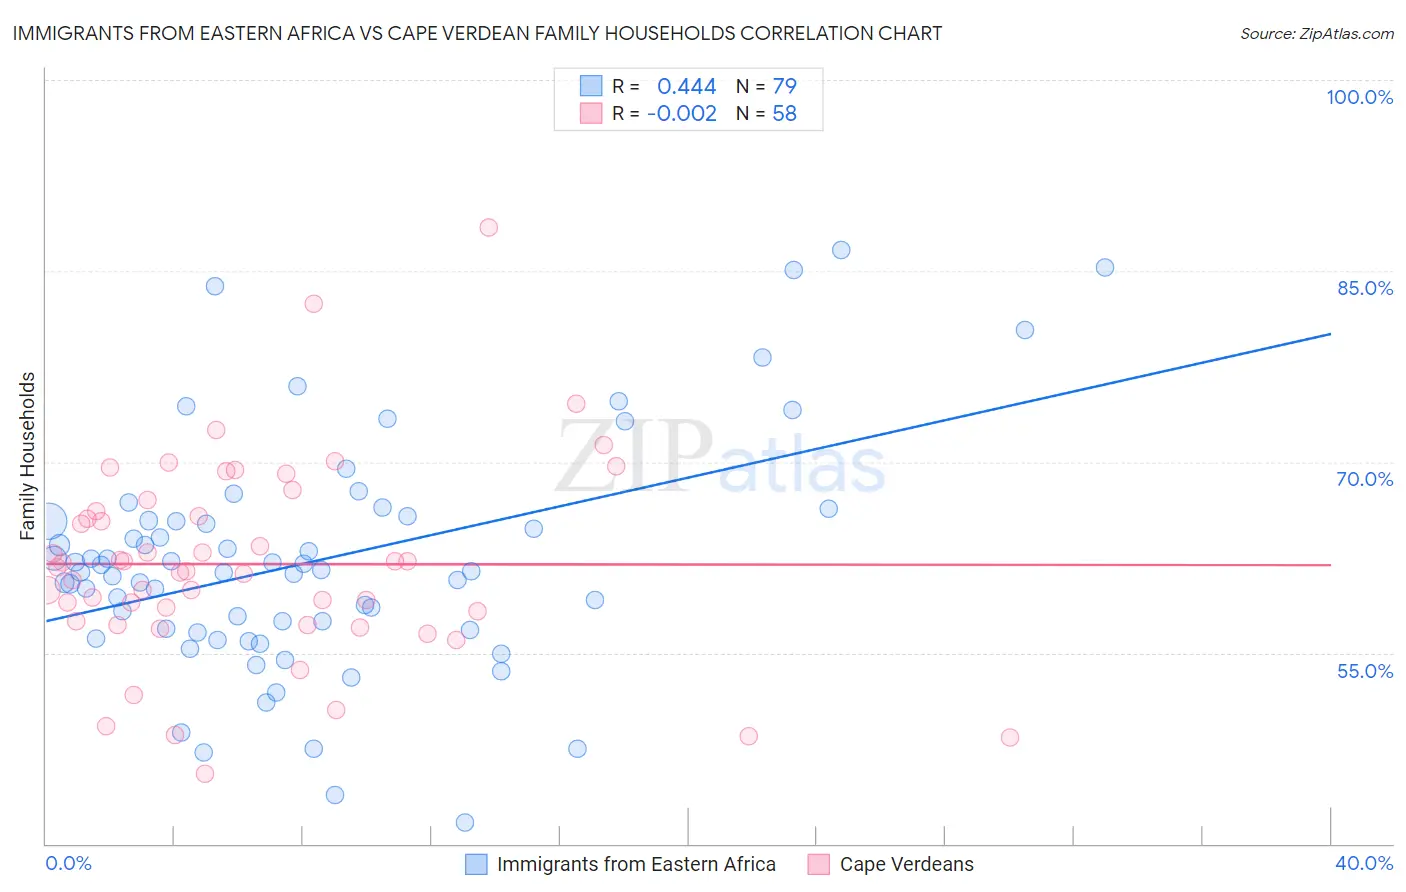
Immigrants from Eastern Africa vs Cape Verdean Family Households Correlation Chart
The statistical analysis conducted on geographies consisting of 354,874,836 people shows a moderate positive correlation between the proportion of Immigrants from Eastern Africa and percentage of family households in the United States with a correlation coefficient (R) of 0.444 and weighted average of 61.1%. Similarly, the statistical analysis conducted on geographies consisting of 107,550,283 people shows no correlation between the proportion of Cape Verdeans and percentage of family households in the United States with a correlation coefficient (R) of -0.002 and weighted average of 61.8%, a difference of 1.0%.
Family Households Correlation Summary
| Measurement | Immigrants from Eastern Africa | Cape Verdean |
| Minimum | 41.7% | 45.5% |
| Maximum | 86.7% | 88.4% |
| Range | 45.0% | 42.9% |
| Mean | 62.2% | 62.0% |
| Median | 61.4% | 61.5% |
| Interquartile 25% (IQ1) | 56.8% | 57.5% |
| Interquartile 75% (IQ3) | 65.4% | 66.1% |
| Interquartile Range (IQR) | 8.6% | 8.6% |
| Standard Deviation (Sample) | 9.1% | 7.9% |
| Standard Deviation (Population) | 9.0% | 7.8% |
Demographics Similar to Immigrants from Eastern Africa and Cape Verdeans by Family Households
In terms of family households, the demographic groups most similar to Immigrants from Eastern Africa are Immigrants from Ethiopia (61.2%, a difference of 0.080%), Carpatho Rusyn (61.1%, a difference of 0.12%), Ethiopian (61.2%, a difference of 0.16%), Immigrants from Australia (61.3%, a difference of 0.24%), and Immigrants from France (61.3%, a difference of 0.24%). Similarly, the demographic groups most similar to Cape Verdeans are Alaskan Athabascan (61.8%, a difference of 0.060%), Ugandan (61.7%, a difference of 0.12%), Immigrants from Bosnia and Herzegovina (61.9%, a difference of 0.14%), Alsatian (61.7%, a difference of 0.17%), and Immigrants from Middle Africa (61.9%, a difference of 0.18%).
| Demographics | Rating | Rank | Family Households |
| Immigrants | Middle Africa | 0.0 /100 | #316 | Tragic 61.9% |
| Immigrants | Bosnia and Herzegovina | 0.0 /100 | #317 | Tragic 61.9% |
| Alaskan Athabascans | 0.0 /100 | #318 | Tragic 61.8% |
| Cape Verdeans | 0.0 /100 | #319 | Tragic 61.8% |
| Ugandans | 0.0 /100 | #320 | Tragic 61.7% |
| Alsatians | 0.0 /100 | #321 | Tragic 61.7% |
| Immigrants | Serbia | 0.0 /100 | #322 | Tragic 61.6% |
| Tlingit-Haida | 0.0 /100 | #323 | Tragic 61.6% |
| Immigrants | West Indies | 0.0 /100 | #324 | Tragic 61.6% |
| Immigrants | Switzerland | 0.0 /100 | #325 | Tragic 61.6% |
| Indonesians | 0.0 /100 | #326 | Tragic 61.5% |
| Blacks/African Americans | 0.0 /100 | #327 | Tragic 61.5% |
| Kiowa | 0.0 /100 | #328 | Tragic 61.4% |
| Cambodians | 0.0 /100 | #329 | Tragic 61.4% |
| Immigrants | Australia | 0.0 /100 | #330 | Tragic 61.3% |
| Immigrants | France | 0.0 /100 | #331 | Tragic 61.3% |
| Ethiopians | 0.0 /100 | #332 | Tragic 61.2% |
| Immigrants | Ethiopia | 0.0 /100 | #333 | Tragic 61.2% |
| Immigrants | Eastern Africa | 0.0 /100 | #334 | Tragic 61.1% |
| Carpatho Rusyns | 0.0 /100 | #335 | Tragic 61.1% |
| German Russians | 0.0 /100 | #336 | Tragic 60.9% |