Immigrants from Ethiopia vs Yuman Family Households
COMPARE
Immigrants from Ethiopia
Yuman
Family Households
Family Households Comparison
Immigrants from Ethiopia
Yuman
61.2%
FAMILY HOUSEHOLDS
0.0/ 100
METRIC RATING
333rd/ 347
METRIC RANK
69.3%
FAMILY HOUSEHOLDS
100.0/ 100
METRIC RATING
5th/ 347
METRIC RANK
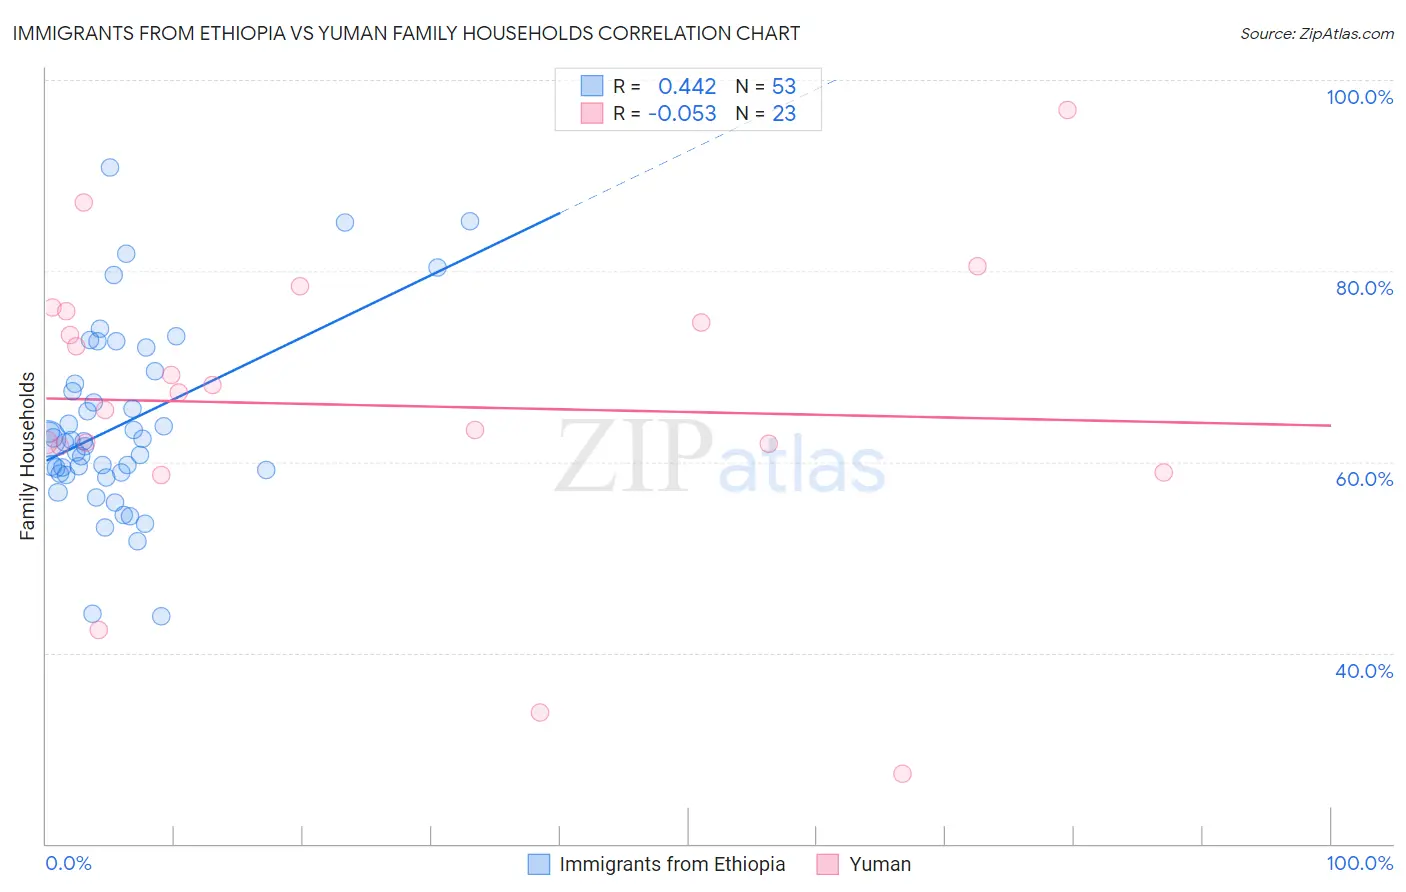
Immigrants from Ethiopia vs Yuman Family Households Correlation Chart
The statistical analysis conducted on geographies consisting of 211,469,180 people shows a moderate positive correlation between the proportion of Immigrants from Ethiopia and percentage of family households in the United States with a correlation coefficient (R) of 0.442 and weighted average of 61.2%. Similarly, the statistical analysis conducted on geographies consisting of 40,663,643 people shows a slight negative correlation between the proportion of Yuman and percentage of family households in the United States with a correlation coefficient (R) of -0.053 and weighted average of 69.3%, a difference of 13.2%.
Family Households Correlation Summary
| Measurement | Immigrants from Ethiopia | Yuman |
| Minimum | 43.8% | 27.3% |
| Maximum | 90.8% | 96.9% |
| Range | 47.0% | 69.6% |
| Mean | 63.9% | 65.9% |
| Median | 62.1% | 67.2% |
| Interquartile 25% (IQ1) | 58.8% | 61.6% |
| Interquartile 75% (IQ3) | 68.8% | 75.7% |
| Interquartile Range (IQR) | 10.0% | 14.1% |
| Standard Deviation (Sample) | 9.6% | 15.7% |
| Standard Deviation (Population) | 9.6% | 15.4% |
Similar Demographics by Family Households
Demographics Similar to Immigrants from Ethiopia by Family Households
In terms of family households, the demographic groups most similar to Immigrants from Ethiopia are Ethiopian (61.2%, a difference of 0.080%), Immigrants from Eastern Africa (61.1%, a difference of 0.080%), Immigrants from Australia (61.3%, a difference of 0.16%), Immigrants from France (61.3%, a difference of 0.16%), and Carpatho Rusyn (61.1%, a difference of 0.20%).
| Demographics | Rating | Rank | Family Households |
| Indonesians | 0.0 /100 | #326 | Tragic 61.5% |
| Blacks/African Americans | 0.0 /100 | #327 | Tragic 61.5% |
| Kiowa | 0.0 /100 | #328 | Tragic 61.4% |
| Cambodians | 0.0 /100 | #329 | Tragic 61.4% |
| Immigrants | Australia | 0.0 /100 | #330 | Tragic 61.3% |
| Immigrants | France | 0.0 /100 | #331 | Tragic 61.3% |
| Ethiopians | 0.0 /100 | #332 | Tragic 61.2% |
| Immigrants | Ethiopia | 0.0 /100 | #333 | Tragic 61.2% |
| Immigrants | Eastern Africa | 0.0 /100 | #334 | Tragic 61.1% |
| Carpatho Rusyns | 0.0 /100 | #335 | Tragic 61.1% |
| German Russians | 0.0 /100 | #336 | Tragic 60.9% |
| Soviet Union | 0.0 /100 | #337 | Tragic 60.9% |
| Immigrants | Eritrea | 0.0 /100 | #338 | Tragic 60.8% |
| Immigrants | Saudi Arabia | 0.0 /100 | #339 | Tragic 60.7% |
| Immigrants | Sudan | 0.0 /100 | #340 | Tragic 60.2% |
Demographics Similar to Yuman by Family Households
In terms of family households, the demographic groups most similar to Yuman are Yakama (69.3%, a difference of 0.030%), Immigrants from Mexico (69.1%, a difference of 0.24%), Mexican (69.0%, a difference of 0.45%), Tongan (69.6%, a difference of 0.47%), and Immigrants from Fiji (68.8%, a difference of 0.77%).
| Demographics | Rating | Rank | Family Households |
| Yup'ik | 100 /100 | #1 | Exceptional 72.4% |
| Spanish American Indians | 100.0 /100 | #2 | Exceptional 71.2% |
| Tongans | 100.0 /100 | #3 | Exceptional 69.6% |
| Yakama | 100.0 /100 | #4 | Exceptional 69.3% |
| Yuman | 100.0 /100 | #5 | Exceptional 69.3% |
| Immigrants | Mexico | 100.0 /100 | #6 | Exceptional 69.1% |
| Mexicans | 100.0 /100 | #7 | Exceptional 69.0% |
| Immigrants | Fiji | 100.0 /100 | #8 | Exceptional 68.8% |
| Native Hawaiians | 100.0 /100 | #9 | Exceptional 68.4% |
| Immigrants | Philippines | 100.0 /100 | #10 | Exceptional 68.3% |
| Immigrants | Central America | 100.0 /100 | #11 | Exceptional 68.3% |
| Koreans | 100.0 /100 | #12 | Exceptional 68.3% |
| Pueblo | 100.0 /100 | #13 | Exceptional 68.2% |
| Immigrants | Cuba | 100.0 /100 | #14 | Exceptional 68.2% |
| Assyrians/Chaldeans/Syriacs | 100.0 /100 | #15 | Exceptional 68.2% |