Immigrants from Ethiopia vs Cape Verdean College, 1 year or more
COMPARE
Immigrants from Ethiopia
Cape Verdean
College, 1 year or more
College, 1 year or more Comparison
Immigrants from Ethiopia
Cape Verdeans
62.6%
COLLEGE, 1 YEAR OR MORE
98.2/ 100
METRIC RATING
89th/ 347
METRIC RANK
50.3%
COLLEGE, 1 YEAR OR MORE
0.0/ 100
METRIC RATING
329th/ 347
METRIC RANK
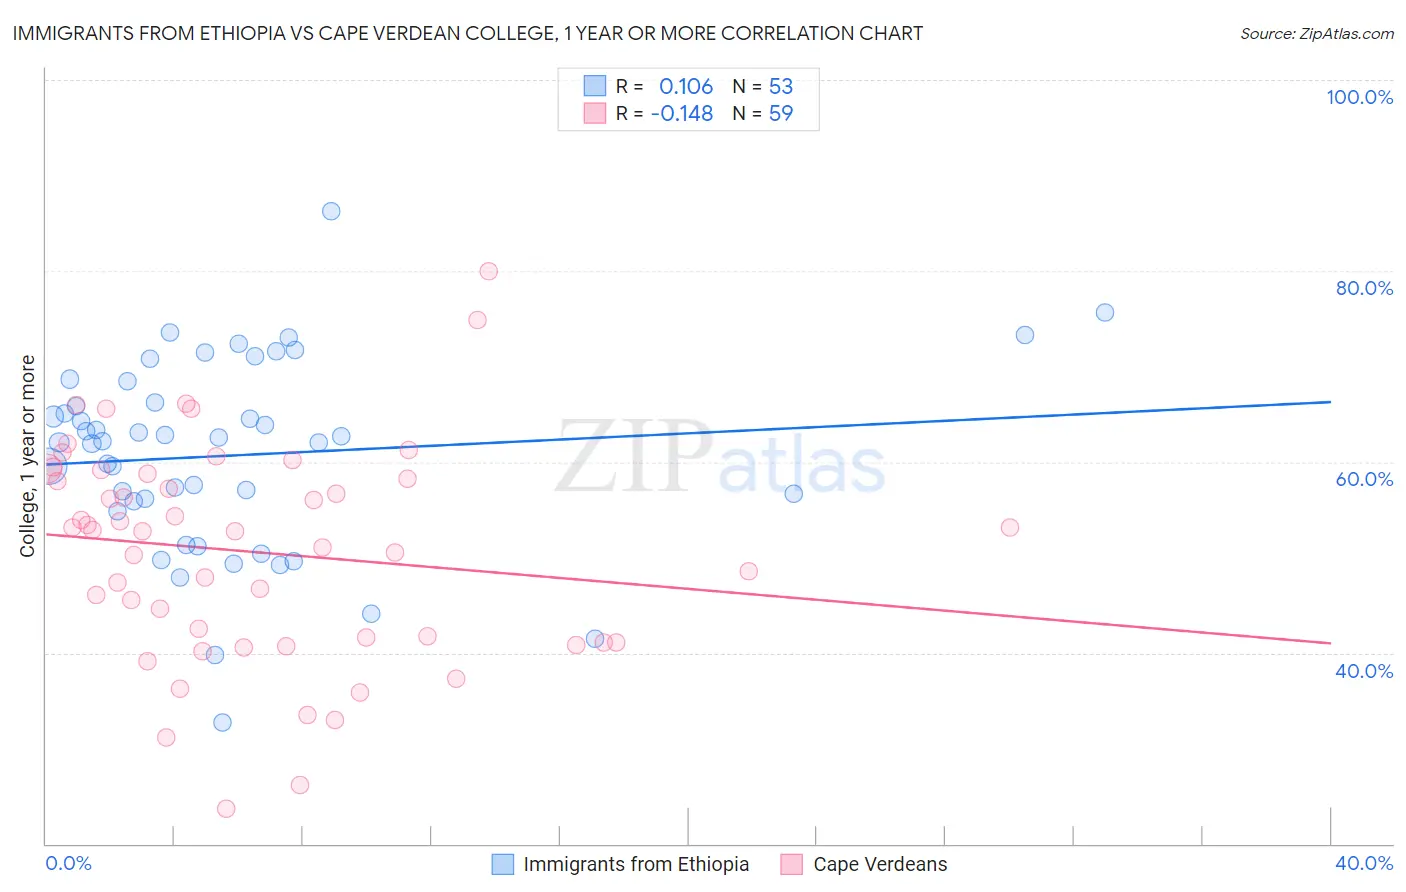
Immigrants from Ethiopia vs Cape Verdean College, 1 year or more Correlation Chart
The statistical analysis conducted on geographies consisting of 211,551,397 people shows a poor positive correlation between the proportion of Immigrants from Ethiopia and percentage of population with at least college, 1 year or more education in the United States with a correlation coefficient (R) of 0.106 and weighted average of 62.6%. Similarly, the statistical analysis conducted on geographies consisting of 107,580,652 people shows a poor negative correlation between the proportion of Cape Verdeans and percentage of population with at least college, 1 year or more education in the United States with a correlation coefficient (R) of -0.148 and weighted average of 50.3%, a difference of 24.4%.
College, 1 year or more Correlation Summary
| Measurement | Immigrants from Ethiopia | Cape Verdean |
| Minimum | 32.7% | 23.7% |
| Maximum | 86.2% | 79.9% |
| Range | 53.5% | 56.2% |
| Mean | 60.7% | 50.6% |
| Median | 62.2% | 52.7% |
| Interquartile 25% (IQ1) | 55.3% | 41.1% |
| Interquartile 75% (IQ3) | 67.3% | 58.8% |
| Interquartile Range (IQR) | 12.0% | 17.7% |
| Standard Deviation (Sample) | 10.1% | 11.4% |
| Standard Deviation (Population) | 10.0% | 11.3% |
Similar Demographics by College, 1 year or more
Demographics Similar to Immigrants from Ethiopia by College, 1 year or more
In terms of college, 1 year or more, the demographic groups most similar to Immigrants from Ethiopia are Greek (62.6%, a difference of 0.10%), Immigrants from Western Asia (62.5%, a difference of 0.17%), Immigrants from Hungary (62.7%, a difference of 0.27%), Immigrants from Eastern Europe (62.4%, a difference of 0.28%), and Immigrants from Western Europe (62.7%, a difference of 0.29%).
| Demographics | Rating | Rank | College, 1 year or more |
| Immigrants | Bolivia | 98.7 /100 | #82 | Exceptional 62.8% |
| Immigrants | Argentina | 98.6 /100 | #83 | Exceptional 62.8% |
| Immigrants | England | 98.6 /100 | #84 | Exceptional 62.8% |
| Immigrants | Pakistan | 98.6 /100 | #85 | Exceptional 62.8% |
| Immigrants | Western Europe | 98.6 /100 | #86 | Exceptional 62.7% |
| Immigrants | Hungary | 98.6 /100 | #87 | Exceptional 62.7% |
| Greeks | 98.3 /100 | #88 | Exceptional 62.6% |
| Immigrants | Ethiopia | 98.2 /100 | #89 | Exceptional 62.6% |
| Immigrants | Western Asia | 97.9 /100 | #90 | Exceptional 62.5% |
| Immigrants | Eastern Europe | 97.8 /100 | #91 | Exceptional 62.4% |
| Immigrants | Egypt | 97.8 /100 | #92 | Exceptional 62.4% |
| Romanians | 97.7 /100 | #93 | Exceptional 62.4% |
| Immigrants | Croatia | 97.6 /100 | #94 | Exceptional 62.3% |
| British | 97.4 /100 | #95 | Exceptional 62.3% |
| Chinese | 97.2 /100 | #96 | Exceptional 62.2% |
Demographics Similar to Cape Verdeans by College, 1 year or more
In terms of college, 1 year or more, the demographic groups most similar to Cape Verdeans are Native/Alaskan (50.2%, a difference of 0.22%), Dutch West Indian (50.5%, a difference of 0.39%), Menominee (50.6%, a difference of 0.51%), Dominican (50.6%, a difference of 0.55%), and Immigrants from Yemen (50.0%, a difference of 0.57%).
| Demographics | Rating | Rank | College, 1 year or more |
| Navajo | 0.0 /100 | #322 | Tragic 50.8% |
| Immigrants | Guatemala | 0.0 /100 | #323 | Tragic 50.7% |
| Immigrants | Cuba | 0.0 /100 | #324 | Tragic 50.7% |
| Immigrants | Latin America | 0.0 /100 | #325 | Tragic 50.7% |
| Dominicans | 0.0 /100 | #326 | Tragic 50.6% |
| Menominee | 0.0 /100 | #327 | Tragic 50.6% |
| Dutch West Indians | 0.0 /100 | #328 | Tragic 50.5% |
| Cape Verdeans | 0.0 /100 | #329 | Tragic 50.3% |
| Natives/Alaskans | 0.0 /100 | #330 | Tragic 50.2% |
| Immigrants | Yemen | 0.0 /100 | #331 | Tragic 50.0% |
| Mexicans | 0.0 /100 | #332 | Tragic 49.2% |
| Immigrants | Dominican Republic | 0.0 /100 | #333 | Tragic 49.1% |
| Lumbee | 0.0 /100 | #334 | Tragic 48.9% |
| Yuman | 0.0 /100 | #335 | Tragic 48.7% |
| Spanish American Indians | 0.0 /100 | #336 | Tragic 48.5% |