Immigrants from Ethiopia vs Argentinean Family Households
COMPARE
Immigrants from Ethiopia
Argentinean
Family Households
Family Households Comparison
Immigrants from Ethiopia
Argentineans
61.2%
FAMILY HOUSEHOLDS
0.0/ 100
METRIC RATING
333rd/ 347
METRIC RANK
65.0%
FAMILY HOUSEHOLDS
95.7/ 100
METRIC RATING
114th/ 347
METRIC RANK
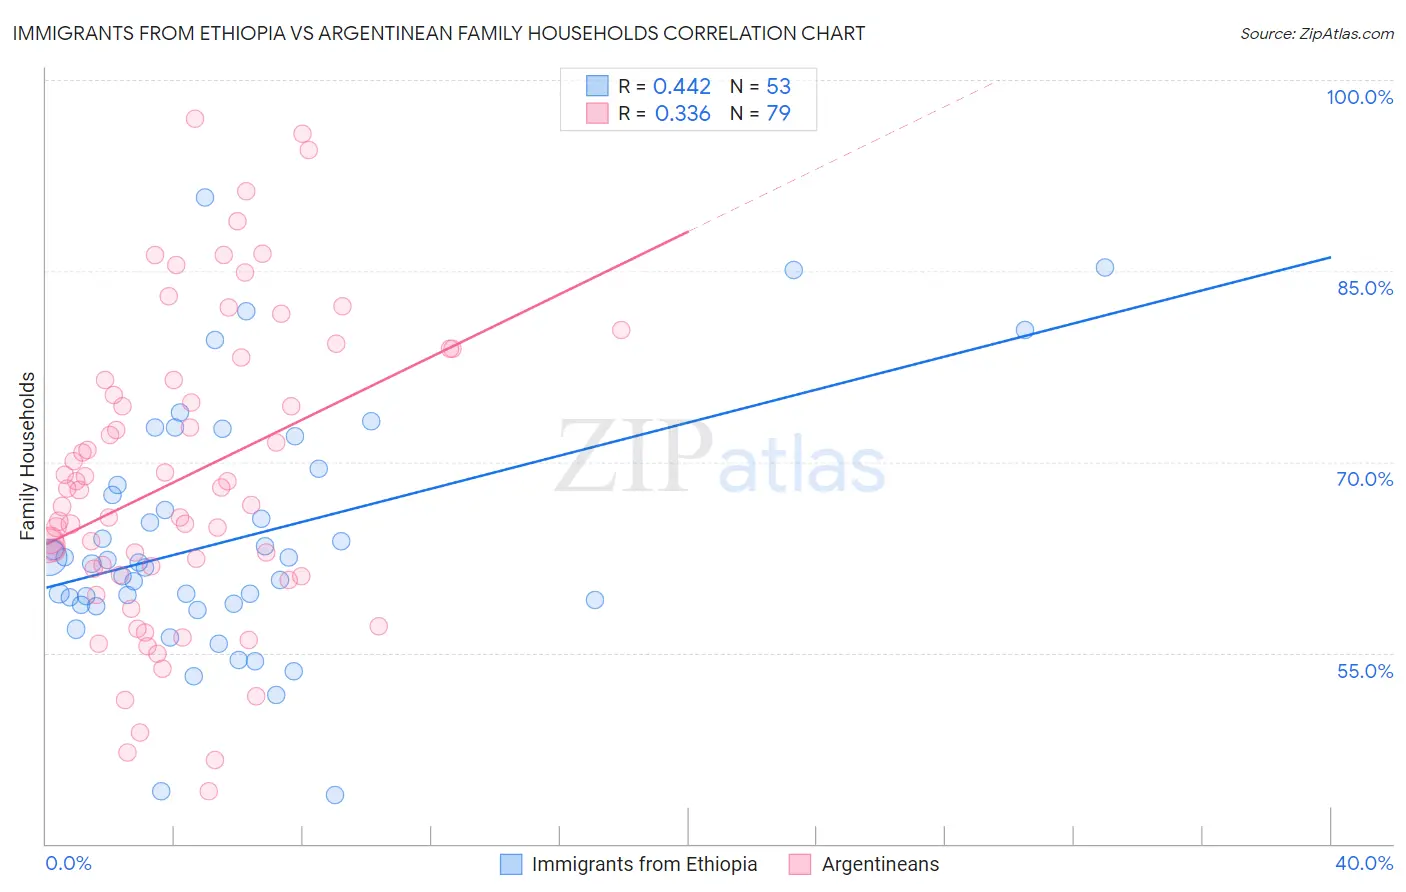
Immigrants from Ethiopia vs Argentinean Family Households Correlation Chart
The statistical analysis conducted on geographies consisting of 211,469,180 people shows a moderate positive correlation between the proportion of Immigrants from Ethiopia and percentage of family households in the United States with a correlation coefficient (R) of 0.442 and weighted average of 61.2%. Similarly, the statistical analysis conducted on geographies consisting of 296,998,100 people shows a mild positive correlation between the proportion of Argentineans and percentage of family households in the United States with a correlation coefficient (R) of 0.336 and weighted average of 65.0%, a difference of 6.2%.
Family Households Correlation Summary
| Measurement | Immigrants from Ethiopia | Argentinean |
| Minimum | 43.8% | 44.1% |
| Maximum | 90.8% | 96.9% |
| Range | 47.0% | 52.8% |
| Mean | 63.9% | 68.8% |
| Median | 62.1% | 67.8% |
| Interquartile 25% (IQ1) | 58.8% | 61.1% |
| Interquartile 75% (IQ3) | 68.8% | 76.5% |
| Interquartile Range (IQR) | 10.0% | 15.4% |
| Standard Deviation (Sample) | 9.6% | 11.9% |
| Standard Deviation (Population) | 9.6% | 11.8% |
Similar Demographics by Family Households
Demographics Similar to Immigrants from Ethiopia by Family Households
In terms of family households, the demographic groups most similar to Immigrants from Ethiopia are Ethiopian (61.2%, a difference of 0.080%), Immigrants from Eastern Africa (61.1%, a difference of 0.080%), Immigrants from Australia (61.3%, a difference of 0.16%), Immigrants from France (61.3%, a difference of 0.16%), and Carpatho Rusyn (61.1%, a difference of 0.20%).
| Demographics | Rating | Rank | Family Households |
| Indonesians | 0.0 /100 | #326 | Tragic 61.5% |
| Blacks/African Americans | 0.0 /100 | #327 | Tragic 61.5% |
| Kiowa | 0.0 /100 | #328 | Tragic 61.4% |
| Cambodians | 0.0 /100 | #329 | Tragic 61.4% |
| Immigrants | Australia | 0.0 /100 | #330 | Tragic 61.3% |
| Immigrants | France | 0.0 /100 | #331 | Tragic 61.3% |
| Ethiopians | 0.0 /100 | #332 | Tragic 61.2% |
| Immigrants | Ethiopia | 0.0 /100 | #333 | Tragic 61.2% |
| Immigrants | Eastern Africa | 0.0 /100 | #334 | Tragic 61.1% |
| Carpatho Rusyns | 0.0 /100 | #335 | Tragic 61.1% |
| German Russians | 0.0 /100 | #336 | Tragic 60.9% |
| Soviet Union | 0.0 /100 | #337 | Tragic 60.9% |
| Immigrants | Eritrea | 0.0 /100 | #338 | Tragic 60.8% |
| Immigrants | Saudi Arabia | 0.0 /100 | #339 | Tragic 60.7% |
| Immigrants | Sudan | 0.0 /100 | #340 | Tragic 60.2% |
Demographics Similar to Argentineans by Family Households
In terms of family households, the demographic groups most similar to Argentineans are Ecuadorian (65.0%, a difference of 0.030%), Immigrants from Iraq (65.0%, a difference of 0.030%), Cherokee (65.0%, a difference of 0.030%), Spanish (65.0%, a difference of 0.040%), and Dutch (64.9%, a difference of 0.050%).
| Demographics | Rating | Rank | Family Households |
| Alaska Natives | 97.3 /100 | #107 | Exceptional 65.1% |
| Palestinians | 97.2 /100 | #108 | Exceptional 65.1% |
| Immigrants | Guatemala | 96.9 /100 | #109 | Exceptional 65.0% |
| Scandinavians | 96.8 /100 | #110 | Exceptional 65.0% |
| Europeans | 96.8 /100 | #111 | Exceptional 65.0% |
| Immigrants | Jordan | 96.5 /100 | #112 | Exceptional 65.0% |
| Spanish | 96.2 /100 | #113 | Exceptional 65.0% |
| Argentineans | 95.7 /100 | #114 | Exceptional 65.0% |
| Ecuadorians | 95.4 /100 | #115 | Exceptional 65.0% |
| Immigrants | Iraq | 95.4 /100 | #116 | Exceptional 65.0% |
| Cherokee | 95.3 /100 | #117 | Exceptional 65.0% |
| Dutch | 95.1 /100 | #118 | Exceptional 64.9% |
| Immigrants | Eastern Asia | 94.4 /100 | #119 | Exceptional 64.9% |
| Immigrants | Oceania | 94.2 /100 | #120 | Exceptional 64.9% |
| Hungarians | 94.0 /100 | #121 | Exceptional 64.9% |