Jordanian vs Cape Verdean Family Households
COMPARE
Jordanian
Cape Verdean
Family Households
Family Households Comparison
Jordanians
Cape Verdeans
65.5%
FAMILY HOUSEHOLDS
99.7/ 100
METRIC RATING
81st/ 347
METRIC RANK
61.8%
FAMILY HOUSEHOLDS
0.0/ 100
METRIC RATING
319th/ 347
METRIC RANK
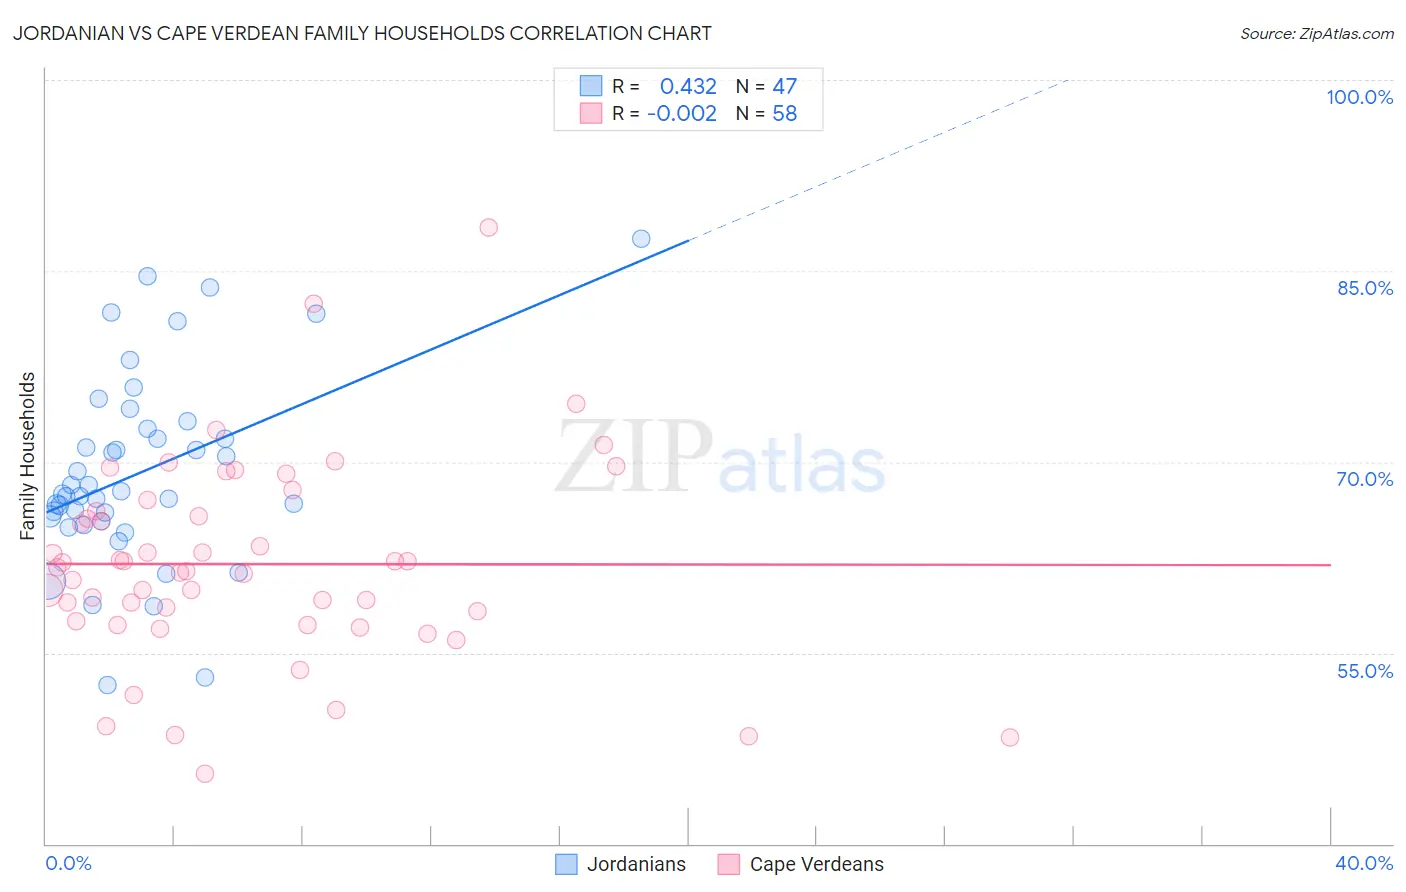
Jordanian vs Cape Verdean Family Households Correlation Chart
The statistical analysis conducted on geographies consisting of 166,395,405 people shows a moderate positive correlation between the proportion of Jordanians and percentage of family households in the United States with a correlation coefficient (R) of 0.432 and weighted average of 65.5%. Similarly, the statistical analysis conducted on geographies consisting of 107,550,283 people shows no correlation between the proportion of Cape Verdeans and percentage of family households in the United States with a correlation coefficient (R) of -0.002 and weighted average of 61.8%, a difference of 6.1%.
Family Households Correlation Summary
| Measurement | Jordanian | Cape Verdean |
| Minimum | 52.5% | 45.5% |
| Maximum | 87.5% | 88.4% |
| Range | 35.0% | 42.9% |
| Mean | 69.1% | 62.0% |
| Median | 67.5% | 61.5% |
| Interquartile 25% (IQ1) | 65.3% | 57.5% |
| Interquartile 75% (IQ3) | 72.6% | 66.1% |
| Interquartile Range (IQR) | 7.3% | 8.6% |
| Standard Deviation (Sample) | 7.5% | 7.9% |
| Standard Deviation (Population) | 7.5% | 7.8% |
Similar Demographics by Family Households
Demographics Similar to Jordanians by Family Households
In terms of family households, the demographic groups most similar to Jordanians are Immigrants from Lebanon (65.5%, a difference of 0.040%), Immigrants from Guyana (65.5%, a difference of 0.040%), American (65.5%, a difference of 0.060%), Puget Sound Salish (65.6%, a difference of 0.080%), and Immigrants from Costa Rica (65.6%, a difference of 0.10%).
| Demographics | Rating | Rank | Family Households |
| Burmese | 99.9 /100 | #74 | Exceptional 65.7% |
| Houma | 99.9 /100 | #75 | Exceptional 65.7% |
| Immigrants | Azores | 99.8 /100 | #76 | Exceptional 65.6% |
| Immigrants | South America | 99.8 /100 | #77 | Exceptional 65.6% |
| Yaqui | 99.8 /100 | #78 | Exceptional 65.6% |
| Immigrants | Costa Rica | 99.8 /100 | #79 | Exceptional 65.6% |
| Puget Sound Salish | 99.8 /100 | #80 | Exceptional 65.6% |
| Jordanians | 99.7 /100 | #81 | Exceptional 65.5% |
| Immigrants | Lebanon | 99.7 /100 | #82 | Exceptional 65.5% |
| Immigrants | Guyana | 99.6 /100 | #83 | Exceptional 65.5% |
| Americans | 99.6 /100 | #84 | Exceptional 65.5% |
| Immigrants | Cambodia | 99.5 /100 | #85 | Exceptional 65.4% |
| Egyptians | 99.4 /100 | #86 | Exceptional 65.4% |
| Immigrants | Egypt | 99.2 /100 | #87 | Exceptional 65.3% |
| Immigrants | Haiti | 99.1 /100 | #88 | Exceptional 65.3% |
Demographics Similar to Cape Verdeans by Family Households
In terms of family households, the demographic groups most similar to Cape Verdeans are Alaskan Athabascan (61.8%, a difference of 0.060%), Ugandan (61.7%, a difference of 0.12%), Immigrants from Bosnia and Herzegovina (61.9%, a difference of 0.14%), Alsatian (61.7%, a difference of 0.17%), and Immigrants from Middle Africa (61.9%, a difference of 0.18%).
| Demographics | Rating | Rank | Family Households |
| Immigrants | Latvia | 0.0 /100 | #312 | Tragic 62.0% |
| Liberians | 0.0 /100 | #313 | Tragic 62.0% |
| Immigrants | Cabo Verde | 0.0 /100 | #314 | Tragic 61.9% |
| Moroccans | 0.0 /100 | #315 | Tragic 61.9% |
| Immigrants | Middle Africa | 0.0 /100 | #316 | Tragic 61.9% |
| Immigrants | Bosnia and Herzegovina | 0.0 /100 | #317 | Tragic 61.9% |
| Alaskan Athabascans | 0.0 /100 | #318 | Tragic 61.8% |
| Cape Verdeans | 0.0 /100 | #319 | Tragic 61.8% |
| Ugandans | 0.0 /100 | #320 | Tragic 61.7% |
| Alsatians | 0.0 /100 | #321 | Tragic 61.7% |
| Immigrants | Serbia | 0.0 /100 | #322 | Tragic 61.6% |
| Tlingit-Haida | 0.0 /100 | #323 | Tragic 61.6% |
| Immigrants | West Indies | 0.0 /100 | #324 | Tragic 61.6% |
| Immigrants | Switzerland | 0.0 /100 | #325 | Tragic 61.6% |
| Indonesians | 0.0 /100 | #326 | Tragic 61.5% |