Immigrants from Ethiopia vs Egyptian Family Households
COMPARE
Immigrants from Ethiopia
Egyptian
Family Households
Family Households Comparison
Immigrants from Ethiopia
Egyptians
61.2%
FAMILY HOUSEHOLDS
0.0/ 100
METRIC RATING
333rd/ 347
METRIC RANK
65.4%
FAMILY HOUSEHOLDS
99.4/ 100
METRIC RATING
86th/ 347
METRIC RANK
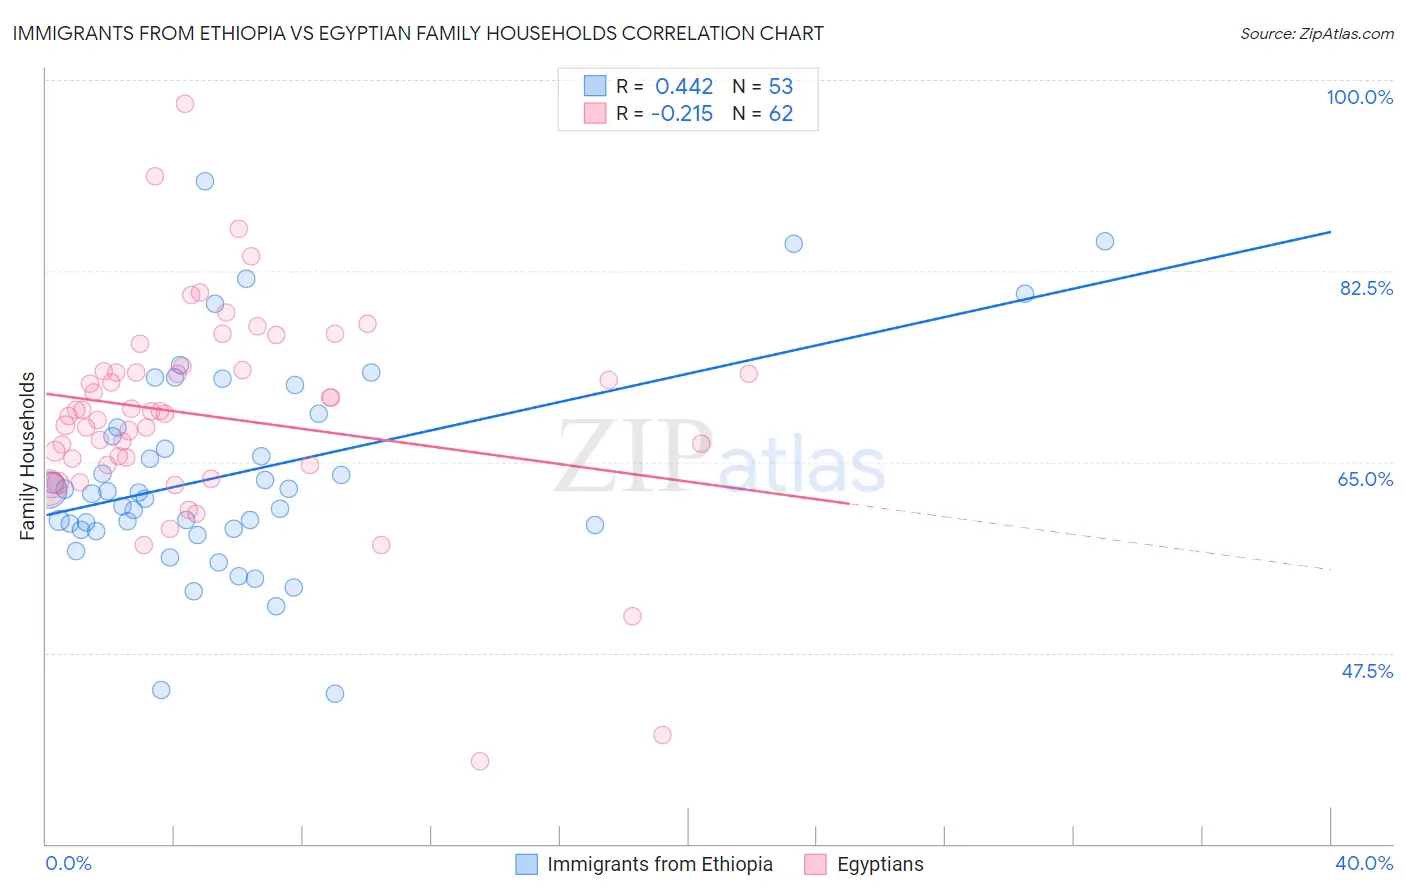
Immigrants from Ethiopia vs Egyptian Family Households Correlation Chart
The statistical analysis conducted on geographies consisting of 211,469,180 people shows a moderate positive correlation between the proportion of Immigrants from Ethiopia and percentage of family households in the United States with a correlation coefficient (R) of 0.442 and weighted average of 61.2%. Similarly, the statistical analysis conducted on geographies consisting of 276,780,466 people shows a weak negative correlation between the proportion of Egyptians and percentage of family households in the United States with a correlation coefficient (R) of -0.215 and weighted average of 65.4%, a difference of 6.9%.
Family Households Correlation Summary
| Measurement | Immigrants from Ethiopia | Egyptian |
| Minimum | 43.8% | 37.6% |
| Maximum | 90.8% | 97.8% |
| Range | 47.0% | 60.2% |
| Mean | 63.9% | 69.2% |
| Median | 62.1% | 69.5% |
| Interquartile 25% (IQ1) | 58.8% | 64.8% |
| Interquartile 75% (IQ3) | 68.8% | 73.3% |
| Interquartile Range (IQR) | 10.0% | 8.6% |
| Standard Deviation (Sample) | 9.6% | 9.7% |
| Standard Deviation (Population) | 9.6% | 9.6% |
Similar Demographics by Family Households
Demographics Similar to Immigrants from Ethiopia by Family Households
In terms of family households, the demographic groups most similar to Immigrants from Ethiopia are Ethiopian (61.2%, a difference of 0.080%), Immigrants from Eastern Africa (61.1%, a difference of 0.080%), Immigrants from Australia (61.3%, a difference of 0.16%), Immigrants from France (61.3%, a difference of 0.16%), and Carpatho Rusyn (61.1%, a difference of 0.20%).
| Demographics | Rating | Rank | Family Households |
| Indonesians | 0.0 /100 | #326 | Tragic 61.5% |
| Blacks/African Americans | 0.0 /100 | #327 | Tragic 61.5% |
| Kiowa | 0.0 /100 | #328 | Tragic 61.4% |
| Cambodians | 0.0 /100 | #329 | Tragic 61.4% |
| Immigrants | Australia | 0.0 /100 | #330 | Tragic 61.3% |
| Immigrants | France | 0.0 /100 | #331 | Tragic 61.3% |
| Ethiopians | 0.0 /100 | #332 | Tragic 61.2% |
| Immigrants | Ethiopia | 0.0 /100 | #333 | Tragic 61.2% |
| Immigrants | Eastern Africa | 0.0 /100 | #334 | Tragic 61.1% |
| Carpatho Rusyns | 0.0 /100 | #335 | Tragic 61.1% |
| German Russians | 0.0 /100 | #336 | Tragic 60.9% |
| Soviet Union | 0.0 /100 | #337 | Tragic 60.9% |
| Immigrants | Eritrea | 0.0 /100 | #338 | Tragic 60.8% |
| Immigrants | Saudi Arabia | 0.0 /100 | #339 | Tragic 60.7% |
| Immigrants | Sudan | 0.0 /100 | #340 | Tragic 60.2% |
Demographics Similar to Egyptians by Family Households
In terms of family households, the demographic groups most similar to Egyptians are Immigrants from Cambodia (65.4%, a difference of 0.050%), Immigrants from Egypt (65.3%, a difference of 0.090%), Immigrants from Haiti (65.3%, a difference of 0.12%), Immigrants from Caribbean (65.3%, a difference of 0.13%), and Immigrants from Laos (65.3%, a difference of 0.14%).
| Demographics | Rating | Rank | Family Households |
| Immigrants | Costa Rica | 99.8 /100 | #79 | Exceptional 65.6% |
| Puget Sound Salish | 99.8 /100 | #80 | Exceptional 65.6% |
| Jordanians | 99.7 /100 | #81 | Exceptional 65.5% |
| Immigrants | Lebanon | 99.7 /100 | #82 | Exceptional 65.5% |
| Immigrants | Guyana | 99.6 /100 | #83 | Exceptional 65.5% |
| Americans | 99.6 /100 | #84 | Exceptional 65.5% |
| Immigrants | Cambodia | 99.5 /100 | #85 | Exceptional 65.4% |
| Egyptians | 99.4 /100 | #86 | Exceptional 65.4% |
| Immigrants | Egypt | 99.2 /100 | #87 | Exceptional 65.3% |
| Immigrants | Haiti | 99.1 /100 | #88 | Exceptional 65.3% |
| Immigrants | Caribbean | 99.1 /100 | #89 | Exceptional 65.3% |
| Immigrants | Laos | 99.1 /100 | #90 | Exceptional 65.3% |
| Crow | 98.9 /100 | #91 | Exceptional 65.3% |
| Hopi | 98.8 /100 | #92 | Exceptional 65.3% |
| Guyanese | 98.8 /100 | #93 | Exceptional 65.3% |