Immigrants from Dominica vs Bangladeshi Married-couple Households
COMPARE
Immigrants from Dominica
Bangladeshi
Married-couple Households
Married-couple Households Comparison
Immigrants from Dominica
Bangladeshis
39.4%
MARRIED-COUPLE HOUSEHOLDS
0.0/ 100
METRIC RATING
329th/ 347
METRIC RANK
43.5%
MARRIED-COUPLE HOUSEHOLDS
0.1/ 100
METRIC RATING
264th/ 347
METRIC RANK
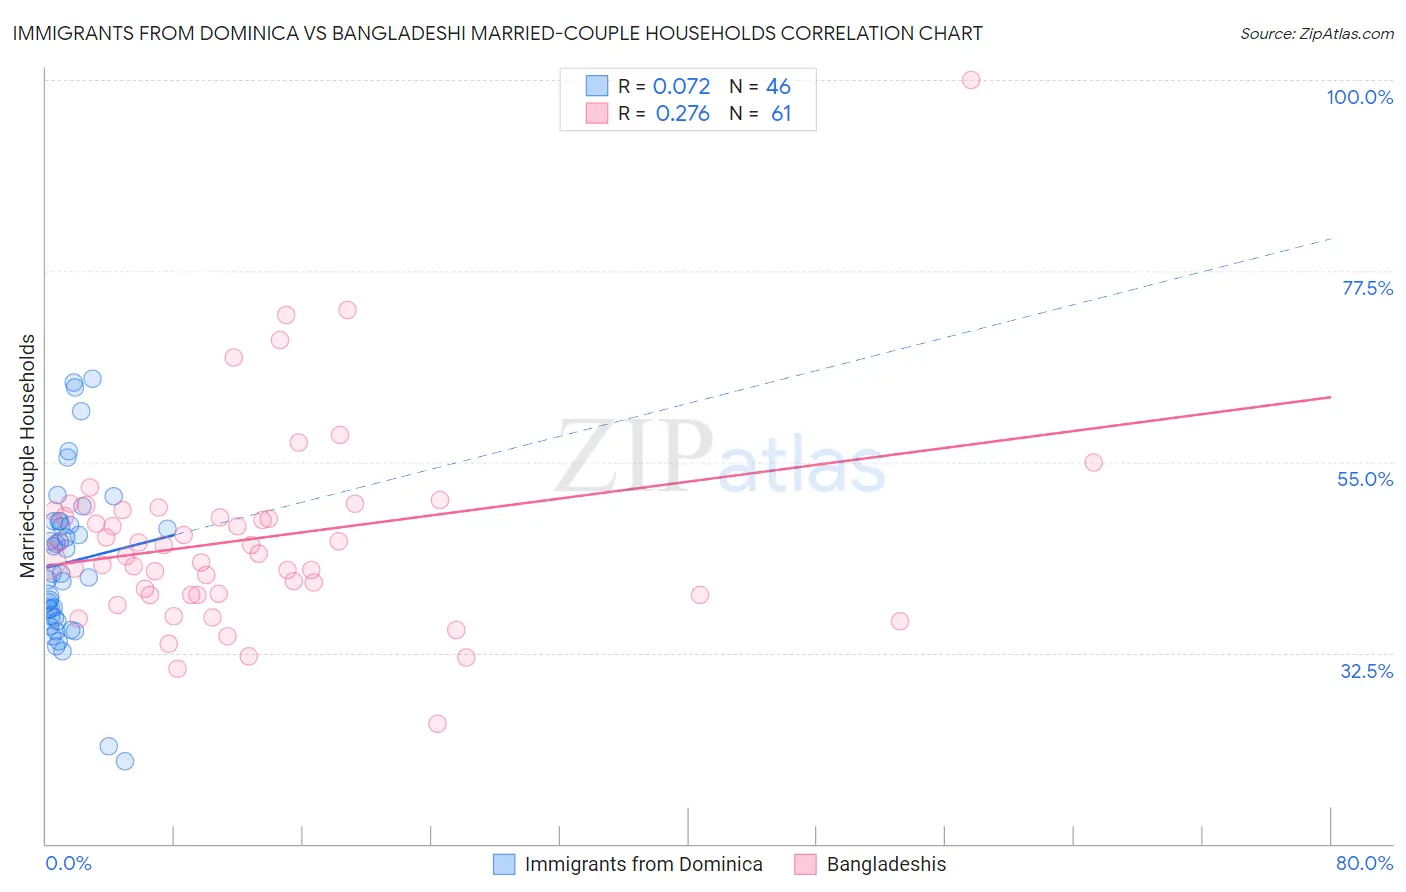
Immigrants from Dominica vs Bangladeshi Married-couple Households Correlation Chart
The statistical analysis conducted on geographies consisting of 83,789,752 people shows a slight positive correlation between the proportion of Immigrants from Dominica and percentage of married-couple family households in the United States with a correlation coefficient (R) of 0.072 and weighted average of 39.4%. Similarly, the statistical analysis conducted on geographies consisting of 141,328,159 people shows a weak positive correlation between the proportion of Bangladeshis and percentage of married-couple family households in the United States with a correlation coefficient (R) of 0.276 and weighted average of 43.5%, a difference of 10.5%.
Married-couple Households Correlation Summary
| Measurement | Immigrants from Dominica | Bangladeshi |
| Minimum | 19.7% | 24.1% |
| Maximum | 64.7% | 100.0% |
| Range | 45.0% | 75.9% |
| Mean | 43.2% | 46.0% |
| Median | 41.9% | 44.1% |
| Interquartile 25% (IQ1) | 36.7% | 39.3% |
| Interquartile 75% (IQ3) | 48.0% | 49.3% |
| Interquartile Range (IQR) | 11.2% | 9.9% |
| Standard Deviation (Sample) | 9.7% | 11.7% |
| Standard Deviation (Population) | 9.6% | 11.6% |
Similar Demographics by Married-couple Households
Demographics Similar to Immigrants from Dominica by Married-couple Households
In terms of married-couple households, the demographic groups most similar to Immigrants from Dominica are Barbadian (39.4%, a difference of 0.080%), Immigrants from Barbados (39.2%, a difference of 0.44%), Lumbee (39.6%, a difference of 0.57%), Immigrants from Congo (39.0%, a difference of 0.88%), and Somali (39.0%, a difference of 0.96%).
| Demographics | Rating | Rank | Married-couple Households |
| Immigrants | Zaire | 0.0 /100 | #322 | Tragic 40.1% |
| Puerto Ricans | 0.0 /100 | #323 | Tragic 40.1% |
| Navajo | 0.0 /100 | #324 | Tragic 40.1% |
| Pueblo | 0.0 /100 | #325 | Tragic 40.0% |
| U.S. Virgin Islanders | 0.0 /100 | #326 | Tragic 39.8% |
| Lumbee | 0.0 /100 | #327 | Tragic 39.6% |
| Barbadians | 0.0 /100 | #328 | Tragic 39.4% |
| Immigrants | Dominica | 0.0 /100 | #329 | Tragic 39.4% |
| Immigrants | Barbados | 0.0 /100 | #330 | Tragic 39.2% |
| Immigrants | Congo | 0.0 /100 | #331 | Tragic 39.0% |
| Somalis | 0.0 /100 | #332 | Tragic 39.0% |
| Immigrants | West Indies | 0.0 /100 | #333 | Tragic 39.0% |
| Immigrants | St. Vincent and the Grenadines | 0.0 /100 | #334 | Tragic 38.7% |
| Senegalese | 0.0 /100 | #335 | Tragic 38.6% |
| Blacks/African Americans | 0.0 /100 | #336 | Tragic 38.5% |
Demographics Similar to Bangladeshis by Married-couple Households
In terms of married-couple households, the demographic groups most similar to Bangladeshis are Moroccan (43.5%, a difference of 0.080%), Cree (43.6%, a difference of 0.11%), Ecuadorian (43.5%, a difference of 0.12%), Native/Alaskan (43.5%, a difference of 0.17%), and Vietnamese (43.6%, a difference of 0.22%).
| Demographics | Rating | Rank | Married-couple Households |
| Blackfeet | 0.2 /100 | #257 | Tragic 43.8% |
| Central American Indians | 0.2 /100 | #258 | Tragic 43.8% |
| Iroquois | 0.2 /100 | #259 | Tragic 43.7% |
| Immigrants | Cameroon | 0.2 /100 | #260 | Tragic 43.7% |
| Alaskan Athabascans | 0.2 /100 | #261 | Tragic 43.6% |
| Vietnamese | 0.2 /100 | #262 | Tragic 43.6% |
| Cree | 0.1 /100 | #263 | Tragic 43.6% |
| Bangladeshis | 0.1 /100 | #264 | Tragic 43.5% |
| Moroccans | 0.1 /100 | #265 | Tragic 43.5% |
| Ecuadorians | 0.1 /100 | #266 | Tragic 43.5% |
| Natives/Alaskans | 0.1 /100 | #267 | Tragic 43.5% |
| Immigrants | Burma/Myanmar | 0.1 /100 | #268 | Tragic 43.4% |
| Immigrants | Sierra Leone | 0.1 /100 | #269 | Tragic 43.3% |
| Yuman | 0.1 /100 | #270 | Tragic 43.3% |
| Guatemalans | 0.1 /100 | #271 | Tragic 43.3% |