Immigrants from Cuba vs Immigrants from Oceania Married-couple Households
COMPARE
Immigrants from Cuba
Immigrants from Oceania
Married-couple Households
Married-couple Households Comparison
Immigrants from Cuba
Immigrants from Oceania
44.2%
MARRIED-COUPLE HOUSEHOLDS
0.6/ 100
METRIC RATING
246th/ 347
METRIC RANK
46.9%
MARRIED-COUPLE HOUSEHOLDS
74.8/ 100
METRIC RATING
157th/ 347
METRIC RANK
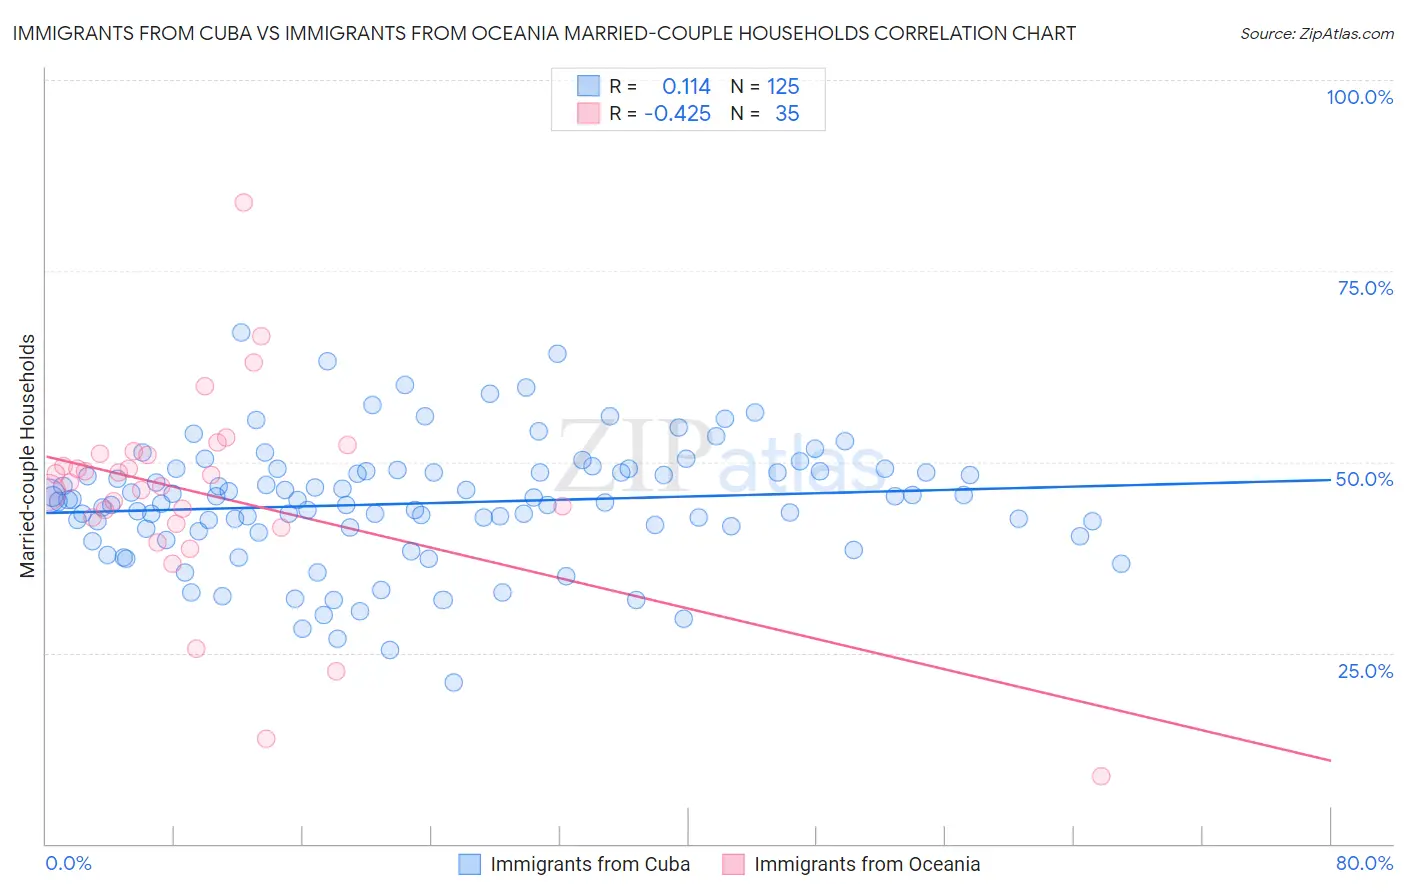
Immigrants from Cuba vs Immigrants from Oceania Married-couple Households Correlation Chart
The statistical analysis conducted on geographies consisting of 325,949,905 people shows a poor positive correlation between the proportion of Immigrants from Cuba and percentage of married-couple family households in the United States with a correlation coefficient (R) of 0.114 and weighted average of 44.2%. Similarly, the statistical analysis conducted on geographies consisting of 305,387,032 people shows a moderate negative correlation between the proportion of Immigrants from Oceania and percentage of married-couple family households in the United States with a correlation coefficient (R) of -0.425 and weighted average of 46.9%, a difference of 6.1%.
Married-couple Households Correlation Summary
| Measurement | Immigrants from Cuba | Immigrants from Oceania |
| Minimum | 21.2% | 8.8% |
| Maximum | 67.0% | 84.0% |
| Range | 45.8% | 75.2% |
| Mean | 44.6% | 45.7% |
| Median | 44.9% | 47.2% |
| Interquartile 25% (IQ1) | 41.1% | 41.9% |
| Interquartile 75% (IQ3) | 48.7% | 51.1% |
| Interquartile Range (IQR) | 7.6% | 9.2% |
| Standard Deviation (Sample) | 8.0% | 13.6% |
| Standard Deviation (Population) | 8.0% | 13.4% |
Similar Demographics by Married-couple Households
Demographics Similar to Immigrants from Cuba by Married-couple Households
In terms of married-couple households, the demographic groups most similar to Immigrants from Cuba are Immigrants from Morocco (44.2%, a difference of 0.0%), Immigrants from El Salvador (44.3%, a difference of 0.15%), Immigrants from Armenia (44.3%, a difference of 0.16%), Yup'ik (44.1%, a difference of 0.28%), and Immigrants from Kenya (44.1%, a difference of 0.33%).
| Demographics | Rating | Rank | Married-couple Households |
| Spanish Americans | 1.1 /100 | #239 | Tragic 44.5% |
| Ute | 1.0 /100 | #240 | Tragic 44.4% |
| Immigrants | Bosnia and Herzegovina | 1.0 /100 | #241 | Tragic 44.4% |
| Immigrants | Albania | 1.0 /100 | #242 | Tragic 44.4% |
| Immigrants | Saudi Arabia | 0.9 /100 | #243 | Tragic 44.4% |
| Immigrants | Armenia | 0.7 /100 | #244 | Tragic 44.3% |
| Immigrants | El Salvador | 0.7 /100 | #245 | Tragic 44.3% |
| Immigrants | Cuba | 0.6 /100 | #246 | Tragic 44.2% |
| Immigrants | Morocco | 0.6 /100 | #247 | Tragic 44.2% |
| Yup'ik | 0.4 /100 | #248 | Tragic 44.1% |
| Immigrants | Kenya | 0.4 /100 | #249 | Tragic 44.1% |
| French American Indians | 0.4 /100 | #250 | Tragic 44.1% |
| German Russians | 0.4 /100 | #251 | Tragic 44.0% |
| Seminole | 0.4 /100 | #252 | Tragic 44.0% |
| Central Americans | 0.3 /100 | #253 | Tragic 43.9% |
Demographics Similar to Immigrants from Oceania by Married-couple Households
In terms of married-couple households, the demographic groups most similar to Immigrants from Oceania are Armenian (46.9%, a difference of 0.030%), Immigrants from Western Asia (46.9%, a difference of 0.060%), Arab (46.9%, a difference of 0.060%), Hmong (47.0%, a difference of 0.070%), and Serbian (47.0%, a difference of 0.080%).
| Demographics | Rating | Rank | Married-couple Households |
| Immigrants | Russia | 77.6 /100 | #150 | Good 47.0% |
| Immigrants | Bulgaria | 76.8 /100 | #151 | Good 47.0% |
| Serbians | 76.3 /100 | #152 | Good 47.0% |
| Hmong | 76.2 /100 | #153 | Good 47.0% |
| Immigrants | Western Asia | 76.1 /100 | #154 | Good 46.9% |
| Arabs | 76.0 /100 | #155 | Good 46.9% |
| Armenians | 75.4 /100 | #156 | Good 46.9% |
| Immigrants | Oceania | 74.8 /100 | #157 | Good 46.9% |
| Immigrants | Nonimmigrants | 73.3 /100 | #158 | Good 46.9% |
| Osage | 73.2 /100 | #159 | Good 46.9% |
| Iraqis | 71.7 /100 | #160 | Good 46.9% |
| Delaware | 71.2 /100 | #161 | Good 46.8% |
| Colombians | 71.0 /100 | #162 | Good 46.8% |
| Immigrants | Turkey | 70.2 /100 | #163 | Good 46.8% |
| Immigrants | Kazakhstan | 70.0 /100 | #164 | Good 46.8% |