Immigrants from Cuba vs Immigrants from Spain Married-couple Households
COMPARE
Immigrants from Cuba
Immigrants from Spain
Married-couple Households
Married-couple Households Comparison
Immigrants from Cuba
Immigrants from Spain
44.2%
MARRIED-COUPLE HOUSEHOLDS
0.6/ 100
METRIC RATING
246th/ 347
METRIC RANK
45.3%
MARRIED-COUPLE HOUSEHOLDS
7.3/ 100
METRIC RATING
211th/ 347
METRIC RANK
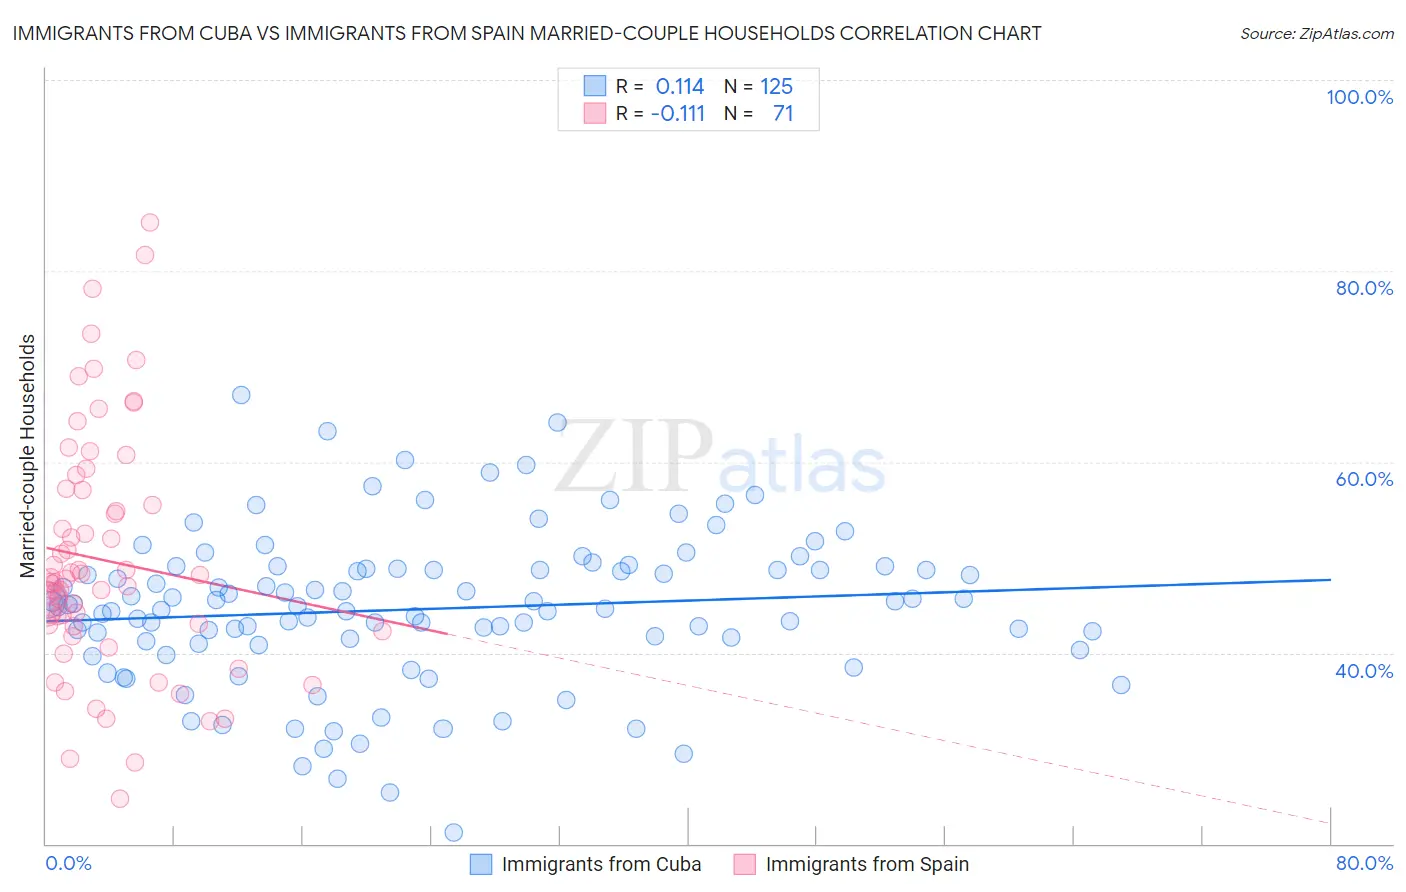
Immigrants from Cuba vs Immigrants from Spain Married-couple Households Correlation Chart
The statistical analysis conducted on geographies consisting of 325,949,905 people shows a poor positive correlation between the proportion of Immigrants from Cuba and percentage of married-couple family households in the United States with a correlation coefficient (R) of 0.114 and weighted average of 44.2%. Similarly, the statistical analysis conducted on geographies consisting of 239,598,425 people shows a poor negative correlation between the proportion of Immigrants from Spain and percentage of married-couple family households in the United States with a correlation coefficient (R) of -0.111 and weighted average of 45.3%, a difference of 2.6%.
Married-couple Households Correlation Summary
| Measurement | Immigrants from Cuba | Immigrants from Spain |
| Minimum | 21.2% | 24.7% |
| Maximum | 67.0% | 85.1% |
| Range | 45.8% | 60.3% |
| Mean | 44.6% | 49.7% |
| Median | 44.9% | 47.4% |
| Interquartile 25% (IQ1) | 41.1% | 42.8% |
| Interquartile 75% (IQ3) | 48.7% | 57.0% |
| Interquartile Range (IQR) | 7.6% | 14.2% |
| Standard Deviation (Sample) | 8.0% | 12.5% |
| Standard Deviation (Population) | 8.0% | 12.4% |
Similar Demographics by Married-couple Households
Demographics Similar to Immigrants from Cuba by Married-couple Households
In terms of married-couple households, the demographic groups most similar to Immigrants from Cuba are Immigrants from Morocco (44.2%, a difference of 0.0%), Immigrants from El Salvador (44.3%, a difference of 0.15%), Immigrants from Armenia (44.3%, a difference of 0.16%), Yup'ik (44.1%, a difference of 0.28%), and Immigrants from Kenya (44.1%, a difference of 0.33%).
| Demographics | Rating | Rank | Married-couple Households |
| Spanish Americans | 1.1 /100 | #239 | Tragic 44.5% |
| Ute | 1.0 /100 | #240 | Tragic 44.4% |
| Immigrants | Bosnia and Herzegovina | 1.0 /100 | #241 | Tragic 44.4% |
| Immigrants | Albania | 1.0 /100 | #242 | Tragic 44.4% |
| Immigrants | Saudi Arabia | 0.9 /100 | #243 | Tragic 44.4% |
| Immigrants | Armenia | 0.7 /100 | #244 | Tragic 44.3% |
| Immigrants | El Salvador | 0.7 /100 | #245 | Tragic 44.3% |
| Immigrants | Cuba | 0.6 /100 | #246 | Tragic 44.2% |
| Immigrants | Morocco | 0.6 /100 | #247 | Tragic 44.2% |
| Yup'ik | 0.4 /100 | #248 | Tragic 44.1% |
| Immigrants | Kenya | 0.4 /100 | #249 | Tragic 44.1% |
| French American Indians | 0.4 /100 | #250 | Tragic 44.1% |
| German Russians | 0.4 /100 | #251 | Tragic 44.0% |
| Seminole | 0.4 /100 | #252 | Tragic 44.0% |
| Central Americans | 0.3 /100 | #253 | Tragic 43.9% |
Demographics Similar to Immigrants from Spain by Married-couple Households
In terms of married-couple households, the demographic groups most similar to Immigrants from Spain are Cuban (45.4%, a difference of 0.050%), Creek (45.3%, a difference of 0.13%), Immigrants from Uzbekistan (45.4%, a difference of 0.14%), Immigrants from France (45.4%, a difference of 0.19%), and Hispanic or Latino (45.4%, a difference of 0.19%).
| Demographics | Rating | Rank | Married-couple Households |
| Aleuts | 12.5 /100 | #204 | Poor 45.6% |
| Nepalese | 11.9 /100 | #205 | Poor 45.6% |
| Uruguayans | 10.4 /100 | #206 | Poor 45.5% |
| Immigrants | France | 8.8 /100 | #207 | Tragic 45.4% |
| Hispanics or Latinos | 8.7 /100 | #208 | Tragic 45.4% |
| Immigrants | Uzbekistan | 8.4 /100 | #209 | Tragic 45.4% |
| Cubans | 7.7 /100 | #210 | Tragic 45.4% |
| Immigrants | Spain | 7.3 /100 | #211 | Tragic 45.3% |
| Creek | 6.4 /100 | #212 | Tragic 45.3% |
| Yakama | 5.8 /100 | #213 | Tragic 45.2% |
| Japanese | 5.7 /100 | #214 | Tragic 45.2% |
| Immigrants | Nepal | 5.6 /100 | #215 | Tragic 45.2% |
| Immigrants | Portugal | 5.6 /100 | #216 | Tragic 45.2% |
| Panamanians | 5.5 /100 | #217 | Tragic 45.2% |
| Immigrants | Azores | 5.3 /100 | #218 | Tragic 45.2% |