Immigrants from Canada vs Uruguayan Family Households
COMPARE
Immigrants from Canada
Uruguayan
Family Households
Family Households Comparison
Immigrants from Canada
Uruguayans
64.0%
FAMILY HOUSEHOLDS
19.2/ 100
METRIC RATING
196th/ 347
METRIC RANK
64.5%
FAMILY HOUSEHOLDS
67.7/ 100
METRIC RATING
155th/ 347
METRIC RANK
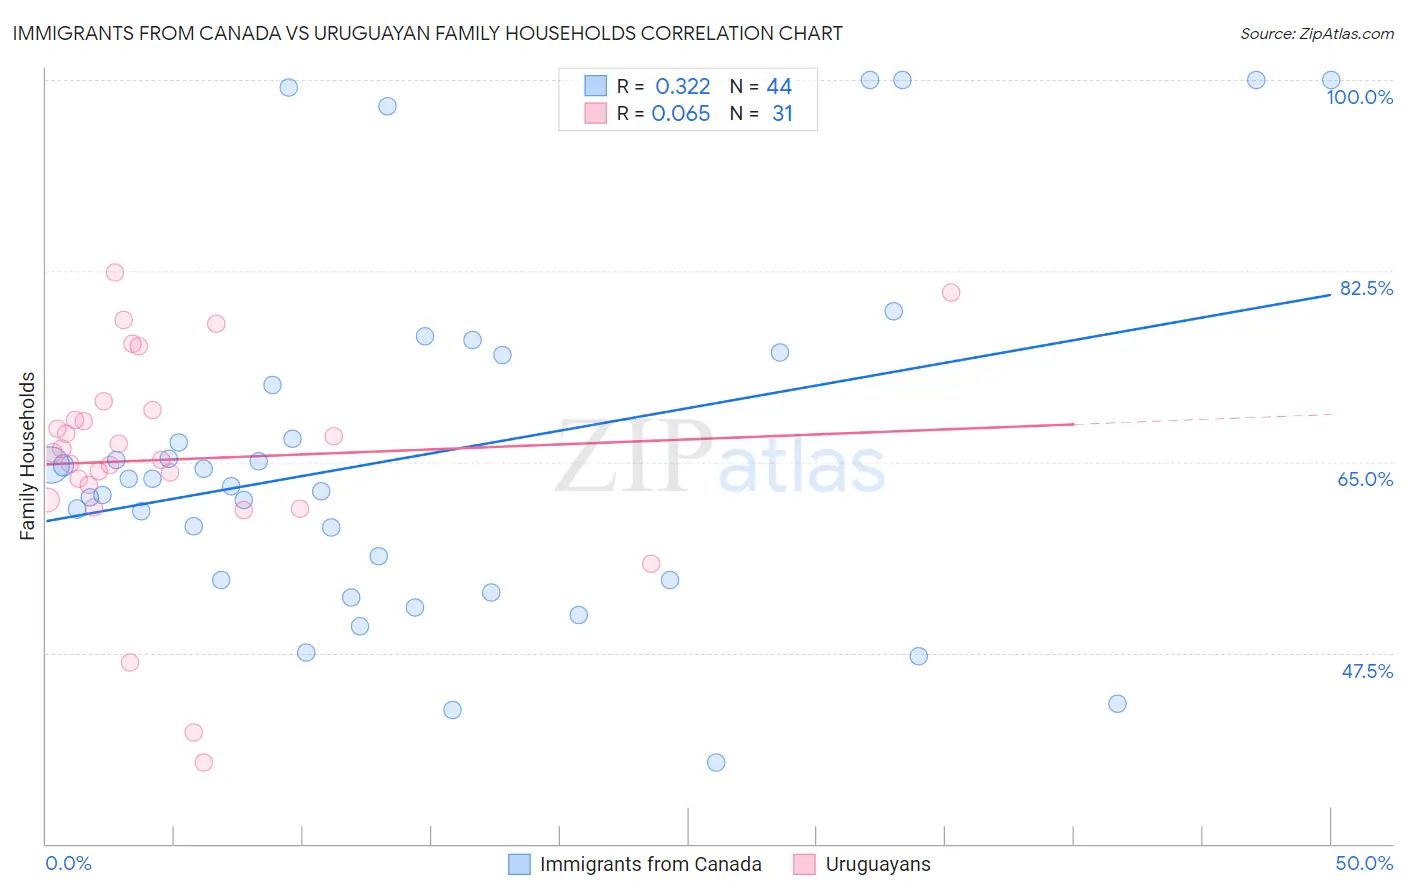
Immigrants from Canada vs Uruguayan Family Households Correlation Chart
The statistical analysis conducted on geographies consisting of 459,128,452 people shows a mild positive correlation between the proportion of Immigrants from Canada and percentage of family households in the United States with a correlation coefficient (R) of 0.322 and weighted average of 64.0%. Similarly, the statistical analysis conducted on geographies consisting of 144,759,449 people shows a slight positive correlation between the proportion of Uruguayans and percentage of family households in the United States with a correlation coefficient (R) of 0.065 and weighted average of 64.5%, a difference of 0.74%.
Family Households Correlation Summary
| Measurement | Immigrants from Canada | Uruguayan |
| Minimum | 37.5% | 37.5% |
| Maximum | 100.0% | 82.3% |
| Range | 62.5% | 44.8% |
| Mean | 65.7% | 65.2% |
| Median | 63.1% | 65.8% |
| Interquartile 25% (IQ1) | 54.2% | 61.5% |
| Interquartile 75% (IQ3) | 73.4% | 69.7% |
| Interquartile Range (IQR) | 19.2% | 8.2% |
| Standard Deviation (Sample) | 16.4% | 10.1% |
| Standard Deviation (Population) | 16.2% | 10.0% |
Similar Demographics by Family Households
Demographics Similar to Immigrants from Canada by Family Households
In terms of family households, the demographic groups most similar to Immigrants from Canada are Seminole (64.0%, a difference of 0.010%), Polish (64.0%, a difference of 0.010%), Slavic (64.0%, a difference of 0.010%), Immigrants from North America (64.0%, a difference of 0.020%), and Immigrants from Malaysia (64.0%, a difference of 0.030%).
| Demographics | Rating | Rank | Family Households |
| Immigrants | Western Asia | 25.3 /100 | #189 | Fair 64.1% |
| Zimbabweans | 24.7 /100 | #190 | Fair 64.1% |
| Arabs | 24.5 /100 | #191 | Fair 64.1% |
| Lithuanians | 23.8 /100 | #192 | Fair 64.0% |
| French | 23.7 /100 | #193 | Fair 64.0% |
| Paiute | 22.2 /100 | #194 | Fair 64.0% |
| Immigrants | North America | 20.0 /100 | #195 | Poor 64.0% |
| Immigrants | Canada | 19.2 /100 | #196 | Poor 64.0% |
| Seminole | 18.9 /100 | #197 | Poor 64.0% |
| Poles | 18.9 /100 | #198 | Poor 64.0% |
| Slavs | 18.6 /100 | #199 | Poor 64.0% |
| Immigrants | Malaysia | 17.9 /100 | #200 | Poor 64.0% |
| Immigrants | Eastern Europe | 17.2 /100 | #201 | Poor 64.0% |
| Iranians | 13.5 /100 | #202 | Poor 63.9% |
| Norwegians | 13.2 /100 | #203 | Poor 63.9% |
Demographics Similar to Uruguayans by Family Households
In terms of family households, the demographic groups most similar to Uruguayans are Austrian (64.5%, a difference of 0.010%), Czech (64.5%, a difference of 0.010%), Canadian (64.4%, a difference of 0.020%), Lebanese (64.4%, a difference of 0.020%), and Swedish (64.5%, a difference of 0.030%).
| Demographics | Rating | Rank | Family Households |
| Delaware | 76.3 /100 | #148 | Good 64.6% |
| Sioux | 76.3 /100 | #149 | Good 64.6% |
| Romanians | 75.3 /100 | #150 | Good 64.5% |
| Syrians | 75.2 /100 | #151 | Good 64.5% |
| Scottish | 70.9 /100 | #152 | Good 64.5% |
| Swedes | 69.8 /100 | #153 | Good 64.5% |
| Austrians | 68.5 /100 | #154 | Good 64.5% |
| Uruguayans | 67.7 /100 | #155 | Good 64.5% |
| Czechs | 67.0 /100 | #156 | Good 64.5% |
| Canadians | 66.6 /100 | #157 | Good 64.4% |
| Lebanese | 66.4 /100 | #158 | Good 64.4% |
| Germans | 65.8 /100 | #159 | Good 64.4% |
| Immigrants | Moldova | 65.2 /100 | #160 | Good 64.4% |
| Immigrants | England | 62.6 /100 | #161 | Good 64.4% |
| British | 61.6 /100 | #162 | Good 64.4% |