Immigrants from Cabo Verde vs Russian Married-couple Households
COMPARE
Immigrants from Cabo Verde
Russian
Married-couple Households
Married-couple Households Comparison
Immigrants from Cabo Verde
Russians
36.2%
MARRIED-COUPLE HOUSEHOLDS
0.0/ 100
METRIC RATING
346th/ 347
METRIC RANK
48.2%
MARRIED-COUPLE HOUSEHOLDS
98.1/ 100
METRIC RATING
80th/ 347
METRIC RANK
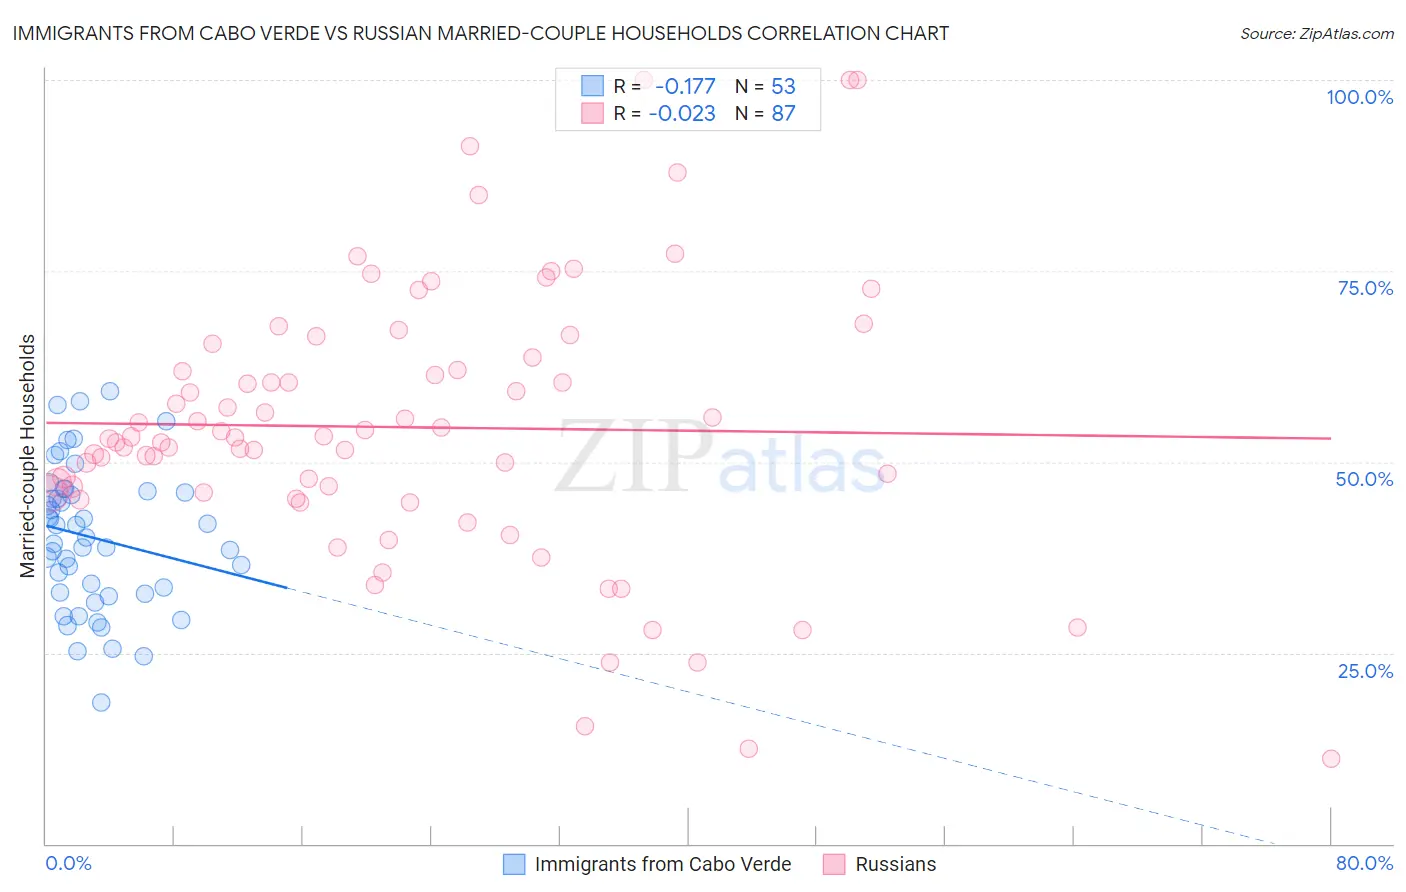
Immigrants from Cabo Verde vs Russian Married-couple Households Correlation Chart
The statistical analysis conducted on geographies consisting of 38,131,070 people shows a poor negative correlation between the proportion of Immigrants from Cabo Verde and percentage of married-couple family households in the United States with a correlation coefficient (R) of -0.177 and weighted average of 36.2%. Similarly, the statistical analysis conducted on geographies consisting of 511,711,387 people shows no correlation between the proportion of Russians and percentage of married-couple family households in the United States with a correlation coefficient (R) of -0.023 and weighted average of 48.2%, a difference of 33.0%.
Married-couple Households Correlation Summary
| Measurement | Immigrants from Cabo Verde | Russian |
| Minimum | 18.5% | 11.1% |
| Maximum | 59.3% | 100.0% |
| Range | 40.8% | 88.9% |
| Mean | 40.1% | 54.5% |
| Median | 40.1% | 53.3% |
| Interquartile 25% (IQ1) | 32.9% | 45.9% |
| Interquartile 75% (IQ3) | 46.1% | 63.7% |
| Interquartile Range (IQR) | 13.2% | 17.8% |
| Standard Deviation (Sample) | 9.3% | 17.9% |
| Standard Deviation (Population) | 9.2% | 17.8% |
Similar Demographics by Married-couple Households
Demographics Similar to Immigrants from Cabo Verde by Married-couple Households
In terms of married-couple households, the demographic groups most similar to Immigrants from Cabo Verde are Hopi (36.7%, a difference of 1.2%), Pima (35.6%, a difference of 1.9%), Immigrants from Dominican Republic (37.3%, a difference of 3.0%), Immigrants from Grenada (37.5%, a difference of 3.5%), and Tohono O'odham (37.9%, a difference of 4.6%).
| Demographics | Rating | Rank | Married-couple Households |
| Immigrants | West Indies | 0.0 /100 | #333 | Tragic 39.0% |
| Immigrants | St. Vincent and the Grenadines | 0.0 /100 | #334 | Tragic 38.7% |
| Senegalese | 0.0 /100 | #335 | Tragic 38.6% |
| Blacks/African Americans | 0.0 /100 | #336 | Tragic 38.5% |
| Immigrants | Somalia | 0.0 /100 | #337 | Tragic 38.4% |
| Immigrants | Senegal | 0.0 /100 | #338 | Tragic 38.4% |
| British West Indians | 0.0 /100 | #339 | Tragic 38.3% |
| Dominicans | 0.0 /100 | #340 | Tragic 38.2% |
| Cape Verdeans | 0.0 /100 | #341 | Tragic 38.1% |
| Tohono O'odham | 0.0 /100 | #342 | Tragic 37.9% |
| Immigrants | Grenada | 0.0 /100 | #343 | Tragic 37.5% |
| Immigrants | Dominican Republic | 0.0 /100 | #344 | Tragic 37.3% |
| Hopi | 0.0 /100 | #345 | Tragic 36.7% |
| Immigrants | Cabo Verde | 0.0 /100 | #346 | Tragic 36.2% |
| Pima | 0.0 /100 | #347 | Tragic 35.6% |
Demographics Similar to Russians by Married-couple Households
In terms of married-couple households, the demographic groups most similar to Russians are Immigrants from Netherlands (48.2%, a difference of 0.020%), Egyptian (48.2%, a difference of 0.030%), Canadian (48.2%, a difference of 0.050%), Finnish (48.1%, a difference of 0.060%), and Immigrants from England (48.2%, a difference of 0.15%).
| Demographics | Rating | Rank | Married-couple Households |
| Immigrants | Singapore | 98.6 /100 | #73 | Exceptional 48.3% |
| Immigrants | Romania | 98.6 /100 | #74 | Exceptional 48.3% |
| Immigrants | England | 98.4 /100 | #75 | Exceptional 48.2% |
| Immigrants | Fiji | 98.4 /100 | #76 | Exceptional 48.2% |
| Canadians | 98.2 /100 | #77 | Exceptional 48.2% |
| Egyptians | 98.2 /100 | #78 | Exceptional 48.2% |
| Immigrants | Netherlands | 98.2 /100 | #79 | Exceptional 48.2% |
| Russians | 98.1 /100 | #80 | Exceptional 48.2% |
| Finns | 98.0 /100 | #81 | Exceptional 48.1% |
| Immigrants | Poland | 97.7 /100 | #82 | Exceptional 48.1% |
| Guamanians/Chamorros | 97.6 /100 | #83 | Exceptional 48.1% |
| Ukrainians | 97.6 /100 | #84 | Exceptional 48.1% |
| Immigrants | Israel | 97.4 /100 | #85 | Exceptional 48.0% |
| Belgians | 97.4 /100 | #86 | Exceptional 48.0% |
| Immigrants | Ireland | 97.3 /100 | #87 | Exceptional 48.0% |