Immigrants from Burma/Myanmar vs Bermudan Births to Unmarried Women
COMPARE
Immigrants from Burma/Myanmar
Bermudan
Births to Unmarried Women
Births to Unmarried Women Comparison
Immigrants from Burma/Myanmar
Bermudans
32.9%
BIRTHS TO UNMARRIED WOMEN
16.7/ 100
METRIC RATING
201st/ 347
METRIC RANK
35.5%
BIRTHS TO UNMARRIED WOMEN
0.6/ 100
METRIC RATING
249th/ 347
METRIC RANK
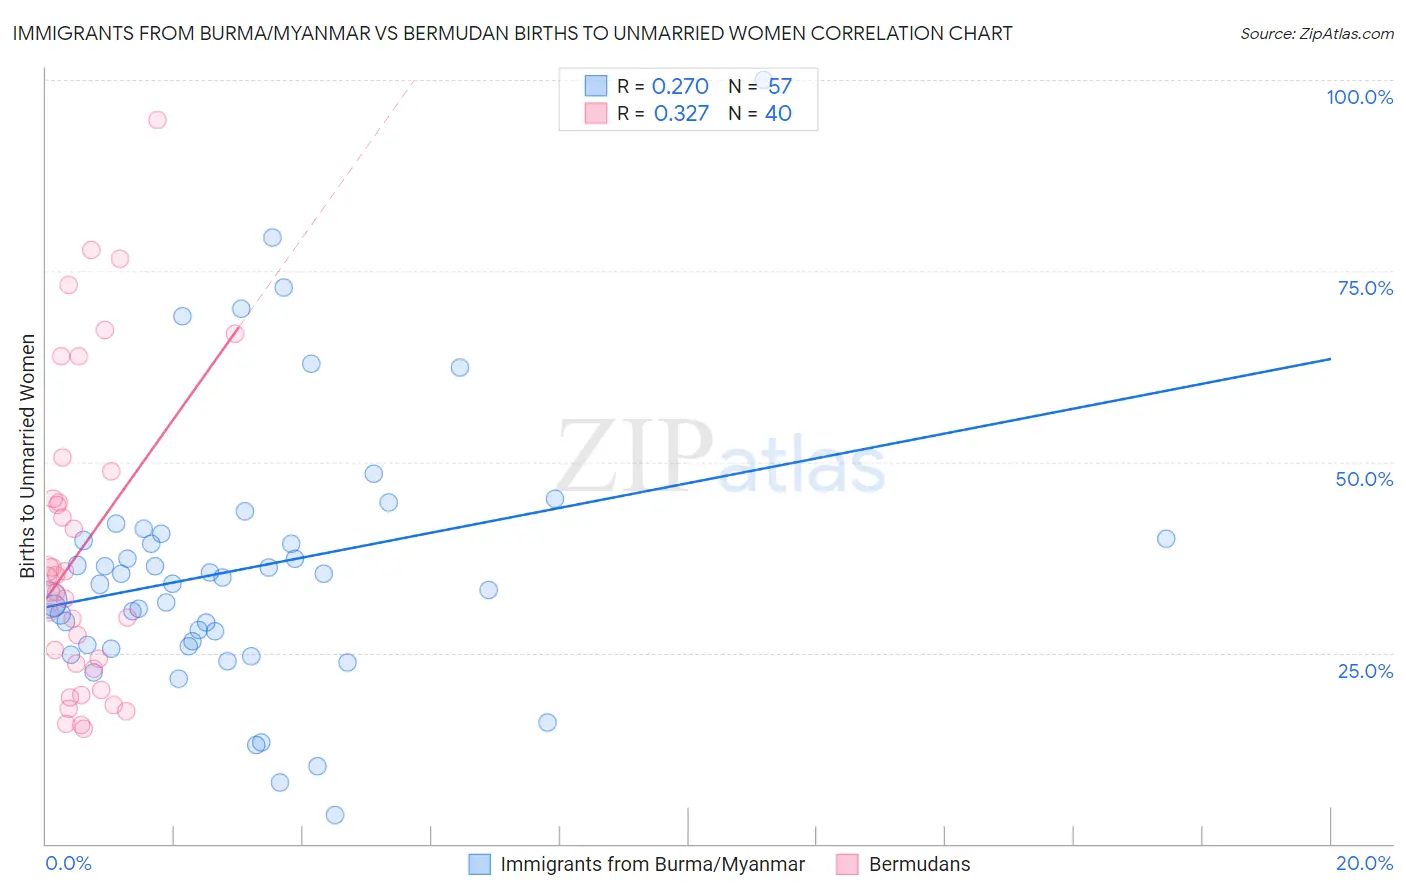
Immigrants from Burma/Myanmar vs Bermudan Births to Unmarried Women Correlation Chart
The statistical analysis conducted on geographies consisting of 166,895,809 people shows a weak positive correlation between the proportion of Immigrants from Burma/Myanmar and percentage of births to unmarried women in the United States with a correlation coefficient (R) of 0.270 and weighted average of 32.9%. Similarly, the statistical analysis conducted on geographies consisting of 54,991,721 people shows a mild positive correlation between the proportion of Bermudans and percentage of births to unmarried women in the United States with a correlation coefficient (R) of 0.327 and weighted average of 35.5%, a difference of 8.1%.
Births to Unmarried Women Correlation Summary
| Measurement | Immigrants from Burma/Myanmar | Bermudan |
| Minimum | 3.8% | 15.1% |
| Maximum | 100.0% | 94.7% |
| Range | 96.2% | 79.6% |
| Mean | 36.0% | 38.7% |
| Median | 34.0% | 34.0% |
| Interquartile 25% (IQ1) | 25.9% | 23.2% |
| Interquartile 75% (IQ3) | 40.3% | 46.9% |
| Interquartile Range (IQR) | 14.4% | 23.7% |
| Standard Deviation (Sample) | 17.5% | 20.2% |
| Standard Deviation (Population) | 17.4% | 20.0% |
Similar Demographics by Births to Unmarried Women
Demographics Similar to Immigrants from Burma/Myanmar by Births to Unmarried Women
In terms of births to unmarried women, the demographic groups most similar to Immigrants from Burma/Myanmar are Immigrants from Micronesia (32.9%, a difference of 0.010%), Immigrants from Germany (32.8%, a difference of 0.33%), Immigrants from Thailand (32.8%, a difference of 0.34%), Ute (33.0%, a difference of 0.39%), and Immigrants from Africa (33.0%, a difference of 0.41%).
| Demographics | Rating | Rank | Births to Unmarried Women |
| Sudanese | 27.3 /100 | #194 | Fair 32.4% |
| Samoans | 21.9 /100 | #195 | Fair 32.6% |
| Immigrants | Colombia | 21.7 /100 | #196 | Fair 32.6% |
| Immigrants | Immigrants | 20.6 /100 | #197 | Fair 32.7% |
| Costa Ricans | 20.3 /100 | #198 | Fair 32.7% |
| Immigrants | Thailand | 18.9 /100 | #199 | Poor 32.8% |
| Immigrants | Germany | 18.8 /100 | #200 | Poor 32.8% |
| Immigrants | Burma/Myanmar | 16.7 /100 | #201 | Poor 32.9% |
| Immigrants | Micronesia | 16.6 /100 | #202 | Poor 32.9% |
| Ute | 14.4 /100 | #203 | Poor 33.0% |
| Immigrants | Africa | 14.3 /100 | #204 | Poor 33.0% |
| German Russians | 13.1 /100 | #205 | Poor 33.1% |
| Uruguayans | 12.8 /100 | #206 | Poor 33.1% |
| Immigrants | Sudan | 11.5 /100 | #207 | Poor 33.2% |
| Hawaiians | 11.3 /100 | #208 | Poor 33.2% |
Demographics Similar to Bermudans by Births to Unmarried Women
In terms of births to unmarried women, the demographic groups most similar to Bermudans are Nonimmigrants (35.5%, a difference of 0.010%), Immigrants from Nigeria (35.4%, a difference of 0.34%), Nigerian (35.3%, a difference of 0.55%), Mexican American Indian (35.7%, a difference of 0.61%), and Shoshone (35.3%, a difference of 0.66%).
| Demographics | Rating | Rank | Births to Unmarried Women |
| Indonesians | 1.2 /100 | #242 | Tragic 35.0% |
| Japanese | 0.9 /100 | #243 | Tragic 35.2% |
| Guyanese | 0.9 /100 | #244 | Tragic 35.2% |
| Shoshone | 0.8 /100 | #245 | Tragic 35.3% |
| Nigerians | 0.7 /100 | #246 | Tragic 35.3% |
| Immigrants | Nigeria | 0.7 /100 | #247 | Tragic 35.4% |
| Immigrants | Nonimmigrants | 0.6 /100 | #248 | Tragic 35.5% |
| Bermudans | 0.6 /100 | #249 | Tragic 35.5% |
| Mexican American Indians | 0.4 /100 | #250 | Tragic 35.7% |
| Immigrants | Western Africa | 0.3 /100 | #251 | Tragic 36.0% |
| Salvadorans | 0.3 /100 | #252 | Tragic 36.0% |
| Immigrants | Portugal | 0.2 /100 | #253 | Tragic 36.2% |
| Potawatomi | 0.2 /100 | #254 | Tragic 36.2% |
| Chickasaw | 0.2 /100 | #255 | Tragic 36.3% |
| Immigrants | Trinidad and Tobago | 0.2 /100 | #256 | Tragic 36.3% |