Immigrants from Burma/Myanmar vs Immigrants from Ireland Births to Unmarried Women
COMPARE
Immigrants from Burma/Myanmar
Immigrants from Ireland
Births to Unmarried Women
Births to Unmarried Women Comparison
Immigrants from Burma/Myanmar
Immigrants from Ireland
32.9%
BIRTHS TO UNMARRIED WOMEN
16.7/ 100
METRIC RATING
201st/ 347
METRIC RANK
27.2%
BIRTHS TO UNMARRIED WOMEN
99.7/ 100
METRIC RATING
35th/ 347
METRIC RANK
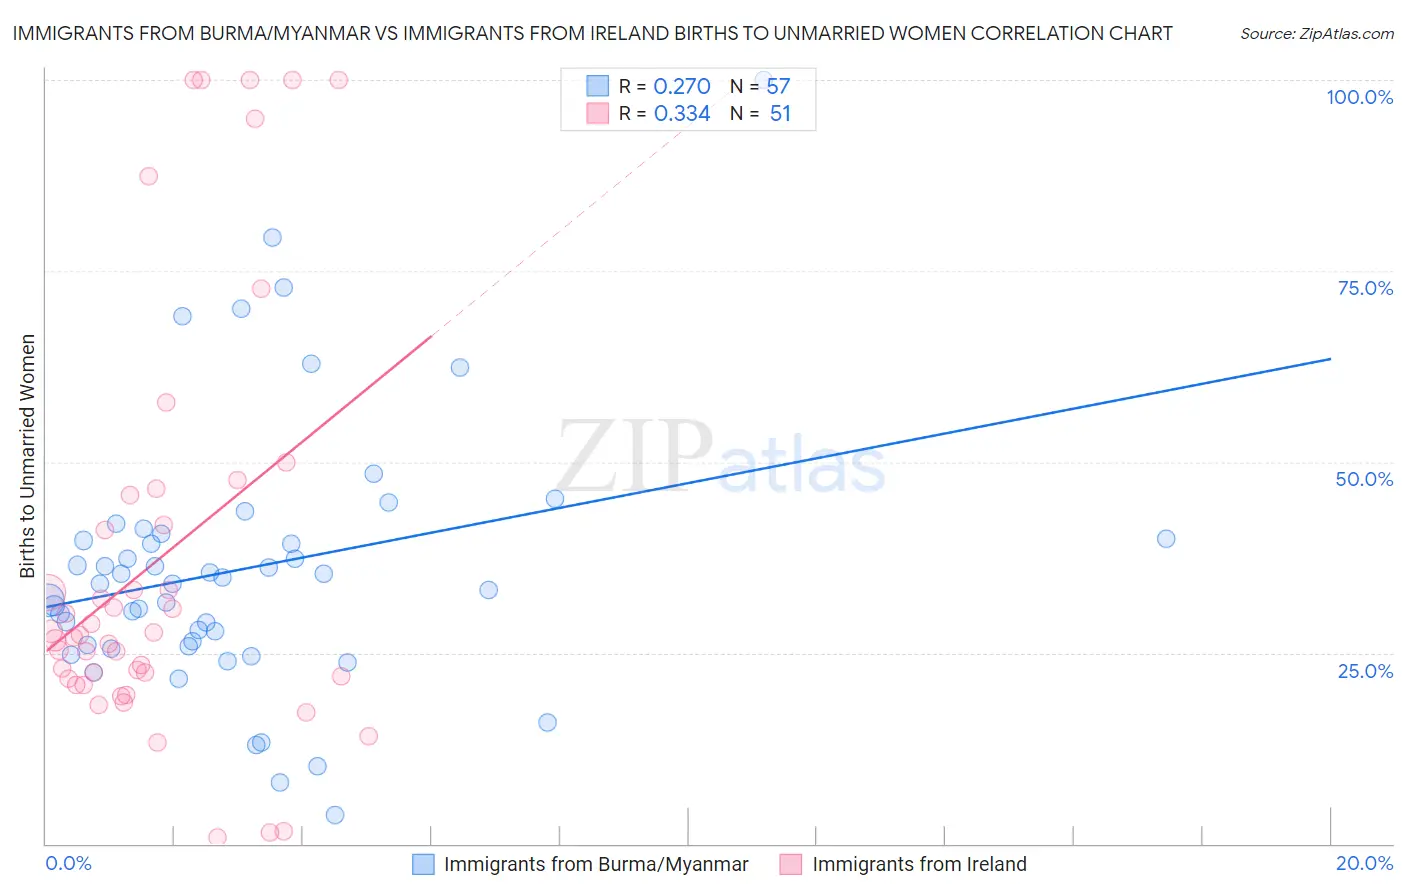
Immigrants from Burma/Myanmar vs Immigrants from Ireland Births to Unmarried Women Correlation Chart
The statistical analysis conducted on geographies consisting of 166,895,809 people shows a weak positive correlation between the proportion of Immigrants from Burma/Myanmar and percentage of births to unmarried women in the United States with a correlation coefficient (R) of 0.270 and weighted average of 32.9%. Similarly, the statistical analysis conducted on geographies consisting of 224,472,100 people shows a mild positive correlation between the proportion of Immigrants from Ireland and percentage of births to unmarried women in the United States with a correlation coefficient (R) of 0.334 and weighted average of 27.2%, a difference of 20.9%.
Births to Unmarried Women Correlation Summary
| Measurement | Immigrants from Burma/Myanmar | Immigrants from Ireland |
| Minimum | 3.8% | 0.80% |
| Maximum | 100.0% | 100.0% |
| Range | 96.2% | 99.2% |
| Mean | 36.0% | 37.2% |
| Median | 34.0% | 27.3% |
| Interquartile 25% (IQ1) | 25.9% | 21.6% |
| Interquartile 75% (IQ3) | 40.3% | 45.6% |
| Interquartile Range (IQR) | 14.4% | 24.0% |
| Standard Deviation (Sample) | 17.5% | 27.5% |
| Standard Deviation (Population) | 17.4% | 27.2% |
Similar Demographics by Births to Unmarried Women
Demographics Similar to Immigrants from Burma/Myanmar by Births to Unmarried Women
In terms of births to unmarried women, the demographic groups most similar to Immigrants from Burma/Myanmar are Immigrants from Micronesia (32.9%, a difference of 0.010%), Immigrants from Germany (32.8%, a difference of 0.33%), Immigrants from Thailand (32.8%, a difference of 0.34%), Ute (33.0%, a difference of 0.39%), and Immigrants from Africa (33.0%, a difference of 0.41%).
| Demographics | Rating | Rank | Births to Unmarried Women |
| Sudanese | 27.3 /100 | #194 | Fair 32.4% |
| Samoans | 21.9 /100 | #195 | Fair 32.6% |
| Immigrants | Colombia | 21.7 /100 | #196 | Fair 32.6% |
| Immigrants | Immigrants | 20.6 /100 | #197 | Fair 32.7% |
| Costa Ricans | 20.3 /100 | #198 | Fair 32.7% |
| Immigrants | Thailand | 18.9 /100 | #199 | Poor 32.8% |
| Immigrants | Germany | 18.8 /100 | #200 | Poor 32.8% |
| Immigrants | Burma/Myanmar | 16.7 /100 | #201 | Poor 32.9% |
| Immigrants | Micronesia | 16.6 /100 | #202 | Poor 32.9% |
| Ute | 14.4 /100 | #203 | Poor 33.0% |
| Immigrants | Africa | 14.3 /100 | #204 | Poor 33.0% |
| German Russians | 13.1 /100 | #205 | Poor 33.1% |
| Uruguayans | 12.8 /100 | #206 | Poor 33.1% |
| Immigrants | Sudan | 11.5 /100 | #207 | Poor 33.2% |
| Hawaiians | 11.3 /100 | #208 | Poor 33.2% |
Demographics Similar to Immigrants from Ireland by Births to Unmarried Women
In terms of births to unmarried women, the demographic groups most similar to Immigrants from Ireland are Immigrants from Pakistan (27.2%, a difference of 0.070%), Immigrants from Western Asia (27.2%, a difference of 0.070%), Immigrants from Sri Lanka (27.2%, a difference of 0.12%), Immigrants from Ukraine (27.2%, a difference of 0.16%), and Immigrants from Russia (27.1%, a difference of 0.19%).
| Demographics | Rating | Rank | Births to Unmarried Women |
| Okinawans | 99.8 /100 | #28 | Exceptional 26.9% |
| Cypriots | 99.8 /100 | #29 | Exceptional 27.0% |
| Bulgarians | 99.8 /100 | #30 | Exceptional 27.1% |
| Immigrants | Iraq | 99.8 /100 | #31 | Exceptional 27.1% |
| Immigrants | Russia | 99.8 /100 | #32 | Exceptional 27.1% |
| Immigrants | Sri Lanka | 99.8 /100 | #33 | Exceptional 27.2% |
| Immigrants | Pakistan | 99.8 /100 | #34 | Exceptional 27.2% |
| Immigrants | Ireland | 99.7 /100 | #35 | Exceptional 27.2% |
| Immigrants | Western Asia | 99.7 /100 | #36 | Exceptional 27.2% |
| Immigrants | Ukraine | 99.7 /100 | #37 | Exceptional 27.2% |
| Immigrants | Moldova | 99.7 /100 | #38 | Exceptional 27.3% |
| Immigrants | Malaysia | 99.7 /100 | #39 | Exceptional 27.4% |
| Turks | 99.6 /100 | #40 | Exceptional 27.4% |
| Iraqis | 99.6 /100 | #41 | Exceptional 27.6% |
| Immigrants | Eastern Europe | 99.6 /100 | #42 | Exceptional 27.6% |