Serbian vs Choctaw Births to Unmarried Women
COMPARE
Serbian
Choctaw
Births to Unmarried Women
Births to Unmarried Women Comparison
Serbians
Choctaw
30.7%
BIRTHS TO UNMARRIED WOMEN
78.8/ 100
METRIC RATING
149th/ 347
METRIC RANK
36.9%
BIRTHS TO UNMARRIED WOMEN
0.1/ 100
METRIC RATING
272nd/ 347
METRIC RANK
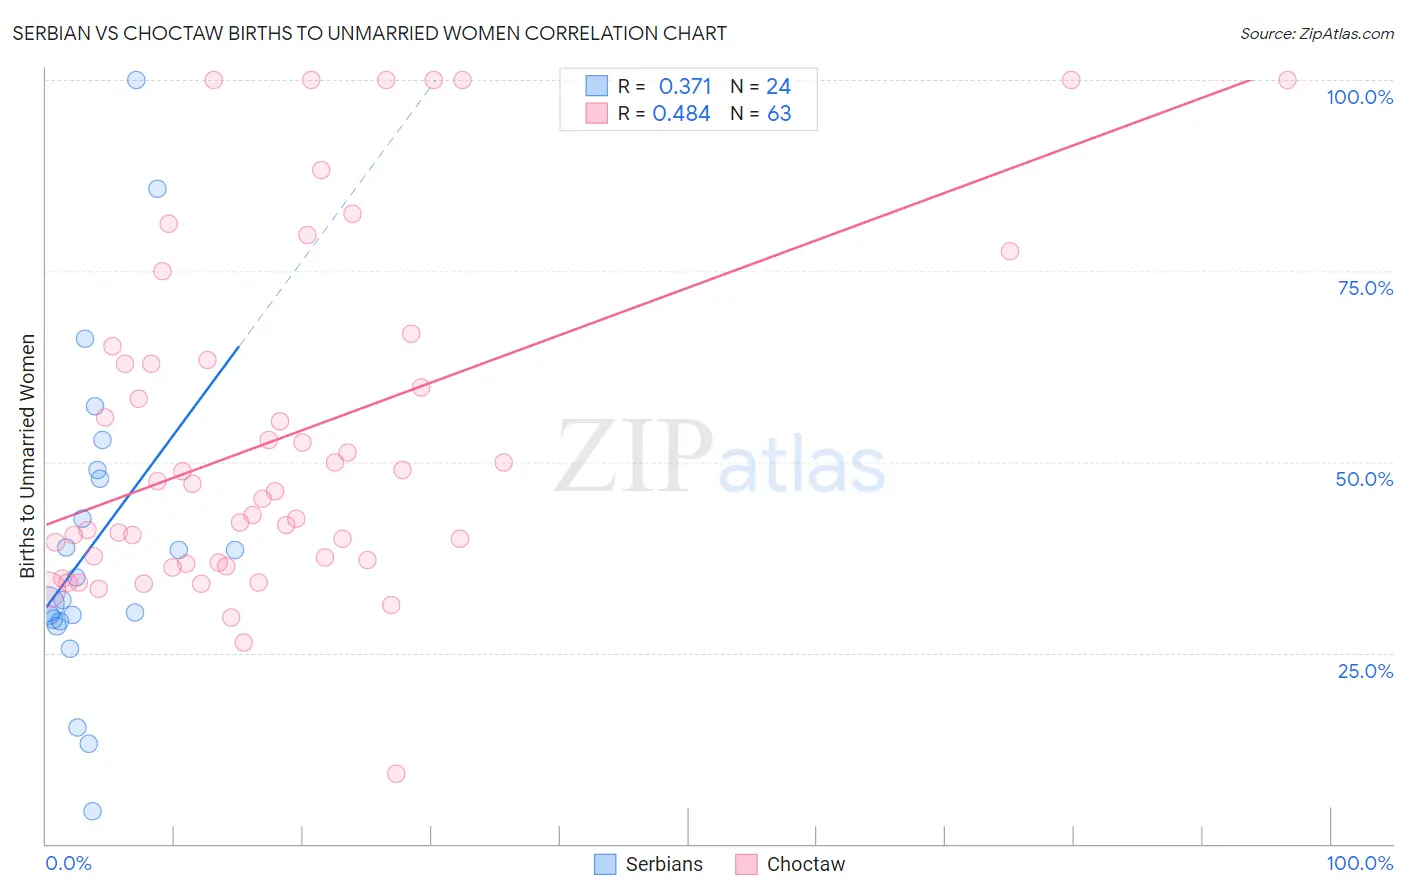
Serbian vs Choctaw Births to Unmarried Women Correlation Chart
The statistical analysis conducted on geographies consisting of 251,582,376 people shows a mild positive correlation between the proportion of Serbians and percentage of births to unmarried women in the United States with a correlation coefficient (R) of 0.371 and weighted average of 30.7%. Similarly, the statistical analysis conducted on geographies consisting of 258,635,203 people shows a moderate positive correlation between the proportion of Choctaw and percentage of births to unmarried women in the United States with a correlation coefficient (R) of 0.484 and weighted average of 36.9%, a difference of 20.2%.
Births to Unmarried Women Correlation Summary
| Measurement | Serbian | Choctaw |
| Minimum | 4.2% | 9.1% |
| Maximum | 100.0% | 100.0% |
| Range | 95.8% | 90.9% |
| Mean | 39.6% | 53.2% |
| Median | 33.4% | 46.2% |
| Interquartile 25% (IQ1) | 29.3% | 36.9% |
| Interquartile 75% (IQ3) | 48.4% | 63.4% |
| Interquartile Range (IQR) | 19.1% | 26.5% |
| Standard Deviation (Sample) | 21.5% | 22.4% |
| Standard Deviation (Population) | 21.1% | 22.2% |
Similar Demographics by Births to Unmarried Women
Demographics Similar to Serbians by Births to Unmarried Women
In terms of births to unmarried women, the demographic groups most similar to Serbians are Chilean (30.7%, a difference of 0.040%), Somali (30.7%, a difference of 0.14%), Italian (30.8%, a difference of 0.26%), Polish (30.8%, a difference of 0.36%), and Immigrants from Oceania (30.6%, a difference of 0.37%).
| Demographics | Rating | Rank | Births to Unmarried Women |
| South Africans | 82.7 /100 | #142 | Excellent 30.5% |
| Immigrants | Uganda | 82.6 /100 | #143 | Excellent 30.5% |
| Czechs | 82.1 /100 | #144 | Excellent 30.5% |
| Immigrants | North America | 81.5 /100 | #145 | Excellent 30.6% |
| Northern Europeans | 81.4 /100 | #146 | Excellent 30.6% |
| Immigrants | Oceania | 81.2 /100 | #147 | Excellent 30.6% |
| Chileans | 79.1 /100 | #148 | Good 30.7% |
| Serbians | 78.8 /100 | #149 | Good 30.7% |
| Somalis | 77.8 /100 | #150 | Good 30.7% |
| Italians | 77.0 /100 | #151 | Good 30.8% |
| Poles | 76.2 /100 | #152 | Good 30.8% |
| British | 76.0 /100 | #153 | Good 30.8% |
| Yugoslavians | 75.1 /100 | #154 | Good 30.8% |
| Immigrants | Bangladesh | 73.9 /100 | #155 | Good 30.9% |
| Carpatho Rusyns | 73.5 /100 | #156 | Good 30.9% |
Demographics Similar to Choctaw by Births to Unmarried Women
In terms of births to unmarried women, the demographic groups most similar to Choctaw are Mexican (36.9%, a difference of 0.12%), Cree (37.0%, a difference of 0.21%), Immigrants from Barbados (36.8%, a difference of 0.22%), Barbadian (37.0%, a difference of 0.23%), and Immigrants from Congo (36.8%, a difference of 0.24%).
| Demographics | Rating | Rank | Births to Unmarried Women |
| Cherokee | 0.1 /100 | #265 | Tragic 36.7% |
| Immigrants | Senegal | 0.1 /100 | #266 | Tragic 36.7% |
| Central Americans | 0.1 /100 | #267 | Tragic 36.7% |
| Comanche | 0.1 /100 | #268 | Tragic 36.7% |
| Senegalese | 0.1 /100 | #269 | Tragic 36.8% |
| Immigrants | Congo | 0.1 /100 | #270 | Tragic 36.8% |
| Immigrants | Barbados | 0.1 /100 | #271 | Tragic 36.8% |
| Choctaw | 0.1 /100 | #272 | Tragic 36.9% |
| Mexicans | 0.1 /100 | #273 | Tragic 36.9% |
| Cree | 0.1 /100 | #274 | Tragic 37.0% |
| Barbadians | 0.1 /100 | #275 | Tragic 37.0% |
| Belizeans | 0.1 /100 | #276 | Tragic 37.0% |
| Guatemalans | 0.1 /100 | #277 | Tragic 37.1% |
| Immigrants | Latin America | 0.1 /100 | #278 | Tragic 37.1% |
| West Indians | 0.1 /100 | #279 | Tragic 37.3% |