Immigrants from Burma/Myanmar vs Marshallese Births to Unmarried Women

COMPARE

Immigrants from Burma/Myanmar
Race
Ancestry
AfghanAfricanAlaska NativeAlaskan AthabascanAlbanianAleutAlsatianAmericanApacheArabArapahoArgentineanArmenianAssyrian/Chaldean/SyriacAustralianAustrianBahamianBangladeshiBarbadianBasqueBelgianBelizeanBermudanBhutaneseBlackfeetBolivianBrazilianBritishBritish West IndianBulgarianBurmeseCajunCambodianCanadianCape VerdeanCarpatho RusynCelticCentral AmericanCentral American IndianCherokeeCheyenneChickasawChileanChineseChippewaChoctawColombianColvilleComancheCosta RicanCreeCreekCroatianCrowCubanCypriotCzechCzechoslovakianDanishDelawareDominicanDutchDutch West IndianEastern EuropeanEcuadorianEgyptianEnglishEstonianEthiopianEuropeanFijianFilipinoFinnishFrenchFrench American IndianFrench CanadianGermanGerman RussianGhanaianGreekGuamanian/ChamorroGuatemalanGuyaneseHaitianHmongHonduranHopiHoumaHungarianIcelanderIndian (Asian)IndonesianInupiatIranianIraqiIrishIroquoisIsraeliItalianJamaicanJapaneseJordanianKenyanKiowaKoreanLaotianLatvianLebaneseLiberianLithuanianLumbeeLuxembourgerMacedonianMalaysianMalteseMenomineeMexicanMexican American IndianMongolianMoroccanNative HawaiianNavajoNepaleseNew ZealanderNicaraguanNigerianNorthern EuropeanNorwegianOkinawanOsageOttawaPaiutePakistaniPalestinianPanamanianParaguayanPennsylvania GermanPeruvianPimaPolishPortuguesePotawatomiPuebloPuerto RicanPuget Sound SalishRomanianRussianSalvadoranSamoanScandinavianScotch-IrishScottishSeminoleSenegaleseSerbianShoshoneSierra LeoneanSiouxSlavicSlovakSloveneSomaliSouth AfricanSouth AmericanSouth American IndianSoviet UnionSpaniardSpanishSpanish AmericanSpanish American IndianSri LankanSubsaharan AfricanSudaneseSwedishSwissSyrianTaiwaneseThaiTlingit-HaidaTohono O'OdhamTonganTrinidadian and TobagonianTsimshianTurkishU.S. Virgin IslanderUgandanUkrainianUruguayanUteVenezuelanVietnameseWelshWest IndianYakamaYaquiYugoslavianYumanYup'ikZimbabwean
Immigration
NonimmigrantsImmigrantsAfghanistanAfricaAlbaniaArgentinaArmeniaAsiaAustraliaAustriaBahamasBangladeshBarbadosBelarusBelgiumBelizeBoliviaBosnia and HerzegovinaBrazilBulgariaBurma/MyanmarCabo VerdeCambodiaCameroonCanadaCaribbeanCentral AmericaChileChinaColombiaCongoCosta RicaCroatiaCubaCzechoslovakiaDenmarkDominicaDominican RepublicEastern AfricaEastern AsiaEastern EuropeEcuadorEgyptEl SalvadorEnglandEritreaEthiopiaEuropeFijiFranceGermanyGhanaGreeceGrenadaGuatemalaGuyanaHaitiHondurasHong KongHungaryIndiaIndonesiaIranIraqIrelandIsraelItalyJamaicaJapanJordanKazakhstanKenyaKoreaKuwaitLaosLatin AmericaLatviaLebanonLiberiaLithuaniaMalaysiaMexicoMicronesiaMiddle AfricaMoldovaMoroccoNepalNetherlandsNicaraguaNigeriaNorth AmericaNorth MacedoniaNorthern AfricaNorthern EuropeNorwayOceaniaPakistanPanamaPeruPhilippinesPolandPortugalRomaniaRussiaSaudi ArabiaScotlandSenegalSerbiaSierra LeoneSingaporeSomaliaSouth AfricaSouth AmericaSouth Central AsiaSouth Eastern AsiaSouthern EuropeSpainSri LankaSt. Vincent and the GrenadinesSudanSwedenSwitzerlandSyriaTaiwanThailandTrinidad and TobagoTurkeyUgandaUkraineUruguayUzbekistanVenezuelaVietnamWest IndiesWestern AfricaWestern AsiaWestern EuropeYemenZaireZimbabweAzores
Marshallese
Race
Ancestry
AfghanAfricanAlaska NativeAlaskan AthabascanAlbanianAleutAlsatianAmericanApacheArabArapahoArgentineanArmenianAssyrian/Chaldean/SyriacAustralianAustrianBahamianBangladeshiBarbadianBasqueBelgianBelizeanBermudanBhutaneseBlackfeetBolivianBrazilianBritishBritish West IndianBulgarianBurmeseCajunCambodianCanadianCape VerdeanCarpatho RusynCelticCentral AmericanCentral American IndianCherokeeCheyenneChickasawChileanChineseChippewaChoctawColombianColvilleComancheCosta RicanCreeCreekCroatianCrowCubanCypriotCzechCzechoslovakianDanishDelawareDominicanDutchDutch West IndianEastern EuropeanEcuadorianEgyptianEnglishEstonianEthiopianEuropeanFijianFilipinoFinnishFrenchFrench American IndianFrench CanadianGermanGerman RussianGhanaianGreekGuamanian/ChamorroGuatemalanGuyaneseHaitianHmongHonduranHopiHoumaHungarianIcelanderIndian (Asian)IndonesianInupiatIranianIraqiIrishIroquoisIsraeliItalianJamaicanJapaneseJordanianKenyanKiowaKoreanLaotianLatvianLebaneseLiberianLithuanianLumbeeLuxembourgerMacedonianMalaysianMalteseMarshalleseMenomineeMexicanMexican American IndianMongolianMoroccanNative HawaiianNavajoNepaleseNew ZealanderNicaraguanNigerianNorthern EuropeanNorwegianOkinawanOsageOttawaPaiutePakistaniPalestinianPanamanianParaguayanPennsylvania GermanPeruvianPimaPolishPortuguesePotawatomiPuebloPuerto RicanPuget Sound SalishRomanianRussianSalvadoranSamoanScandinavianScotch-IrishScottishSeminoleSenegaleseSerbianShoshoneSierra LeoneanSiouxSlavicSlovakSloveneSomaliSouth AfricanSouth AmericanSouth American IndianSoviet UnionSpaniardSpanishSpanish AmericanSpanish American IndianSri LankanSubsaharan AfricanSudaneseSwedishSwissSyrianTaiwaneseThaiTlingit-HaidaTohono O'OdhamTonganTrinidadian and TobagonianTsimshianTurkishU.S. Virgin IslanderUgandanUkrainianUruguayanUteVenezuelanVietnameseWelshWest IndianYakamaYaquiYugoslavianYumanYup'ikZimbabwean
Immigration
NonimmigrantsImmigrantsAfghanistanAfricaAlbaniaArgentinaArmeniaAsiaAustraliaAustriaBahamasBangladeshBarbadosBelarusBelgiumBelizeBoliviaBosnia and HerzegovinaBrazilBulgariaCabo VerdeCambodiaCameroonCanadaCaribbeanCentral AmericaChileChinaColombiaCongoCosta RicaCroatiaCubaCzechoslovakiaDenmarkDominicaDominican RepublicEastern AfricaEastern AsiaEastern EuropeEcuadorEgyptEl SalvadorEnglandEritreaEthiopiaEuropeFijiFranceGermanyGhanaGreeceGrenadaGuatemalaGuyanaHaitiHondurasHong KongHungaryIndiaIndonesiaIranIraqIrelandIsraelItalyJamaicaJapanJordanKazakhstanKenyaKoreaKuwaitLaosLatin AmericaLatviaLebanonLiberiaLithuaniaMalaysiaMexicoMicronesiaMiddle AfricaMoldovaMoroccoNepalNetherlandsNicaraguaNigeriaNorth AmericaNorth MacedoniaNorthern AfricaNorthern EuropeNorwayOceaniaPakistanPanamaPeruPhilippinesPolandPortugalRomaniaRussiaSaudi ArabiaScotlandSenegalSerbiaSierra LeoneSingaporeSomaliaSouth AfricaSouth AmericaSouth Central AsiaSouth Eastern AsiaSouthern EuropeSpainSri LankaSt. Vincent and the GrenadinesSudanSwedenSwitzerlandSyriaTaiwanThailandTrinidad and TobagoTurkeyUgandaUkraineUruguayUzbekistanVenezuelaVietnamWest IndiesWestern AfricaWestern AsiaWestern EuropeYemenZaireZimbabweAzores
Births to Unmarried Women
Income
Poverty
Unemployment
Labor Participation
Family Structure
Vehicle Availability
Education Level
Disability

Births to Unmarried Women Comparison

Immigrants from Burma/Myanmar

Marshallese

Poor
Tragic
32.9%
BIRTHS TO UNMARRIED WOMEN
16.7/ 100
METRIC RATING
201st/ 347
METRIC RANK
34.8%
BIRTHS TO UNMARRIED WOMEN
1.6/ 100
METRIC RATING
237th/ 347
METRIC RANK

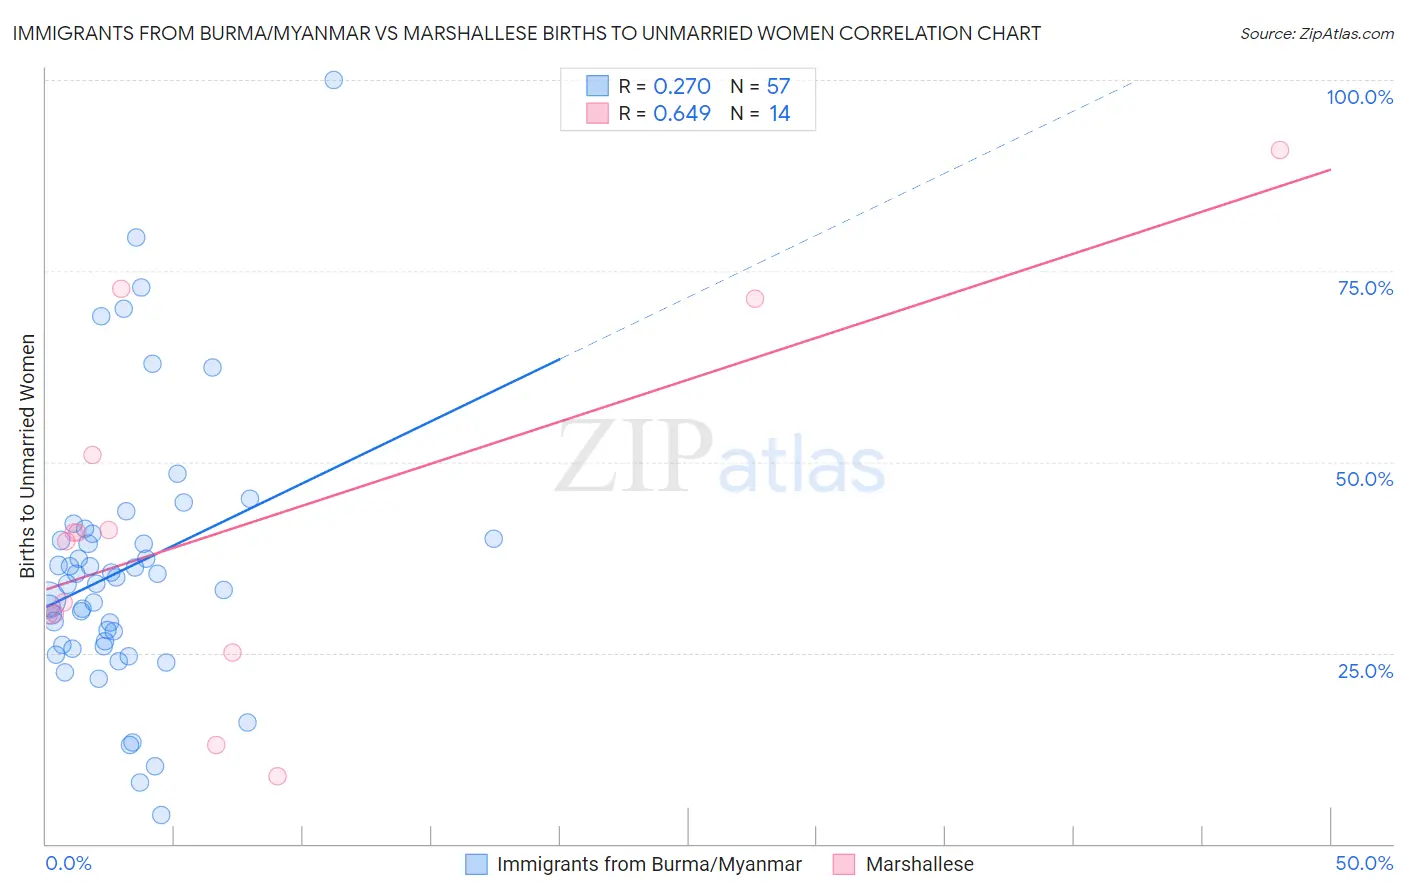
Immigrants from Burma/Myanmar vs Marshallese Births to Unmarried Women Correlation Chart

The statistical analysis conducted on geographies consisting of 166,895,809 people shows a weak positive correlation between the proportion of Immigrants from Burma/Myanmar and percentage of births to unmarried women in the United States with a correlation coefficient (R) of 0.270 and weighted average of 32.9%. Similarly, the statistical analysis conducted on geographies consisting of 14,693,894 people shows a significant positive correlation between the proportion of Marshallese and percentage of births to unmarried women in the United States with a correlation coefficient (R) of 0.649 and weighted average of 34.8%, a difference of 5.7%.
Immigrants from Burma/Myanmar vs Marshallese Births to Unmarried Women

Births to Unmarried Women Correlation Summary

MeasurementImmigrants from Burma/MyanmarMarshallese
Minimum3.8%8.9%
Maximum100.0%90.9%
Range96.2%82.0%
Mean36.0%41.9%
Median34.0%40.2%
Interquartile 25% (IQ1)25.9%30.0%
Interquartile 75% (IQ3)40.3%51.0%
Interquartile Range (IQR)14.4%21.0%
Standard Deviation (Sample)17.5%23.0%
Standard Deviation (Population)17.4%22.2%

Similar Demographics by Births to Unmarried Women

Demographics Similar to Immigrants from Burma/Myanmar by Births to Unmarried Women

In terms of births to unmarried women, the demographic groups most similar to Immigrants from Burma/Myanmar are Immigrants from Micronesia (32.9%, a difference of 0.010%), Immigrants from Germany (32.8%, a difference of 0.33%), Immigrants from Thailand (32.8%, a difference of 0.34%), Ute (33.0%, a difference of 0.39%), and Immigrants from Africa (33.0%, a difference of 0.41%).
DemographicsRating | RankBirths to Unmarried Women
Sudanese
27.3
/100
|
#194
Fair
32.4%
Samoans
21.9
/100
|
#195
Fair
32.6%
Immigrants | Colombia
21.7
/100
|
#196
Fair
32.6%
Immigrants | Immigrants
20.6
/100
|
#197
Fair
32.7%
Costa Ricans
20.3
/100
|
#198
Fair
32.7%
Immigrants | Thailand
18.9
/100
|
#199
Poor
32.8%
Immigrants | Germany
18.8
/100
|
#200
Poor
32.8%
Immigrants | Burma/Myanmar
16.7
/100
|
#201
Poor
32.9%
Immigrants | Micronesia
16.6
/100
|
#202
Poor
32.9%
Ute
14.4
/100
|
#203
Poor
33.0%
Immigrants | Africa
14.3
/100
|
#204
Poor
33.0%
German Russians
13.1
/100
|
#205
Poor
33.1%
Uruguayans
12.8
/100
|
#206
Poor
33.1%
Immigrants | Sudan
11.5
/100
|
#207
Poor
33.2%
Hawaiians
11.3
/100
|
#208
Poor
33.2%

Demographics Similar to Marshallese by Births to Unmarried Women

In terms of births to unmarried women, the demographic groups most similar to Marshallese are Immigrants from Cambodia (34.8%, a difference of 0.060%), Immigrants from Cameroon (34.7%, a difference of 0.070%), Sierra Leonean (34.9%, a difference of 0.28%), Immigrants from Middle Africa (34.9%, a difference of 0.53%), and Immigrants from Guyana (35.0%, a difference of 0.57%).
DemographicsRating | RankBirths to Unmarried Women
Ghanaians
3.1
/100
|
#230
Tragic
34.3%
Native Hawaiians
2.9
/100
|
#231
Tragic
34.3%
French Canadians
2.5
/100
|
#232
Tragic
34.4%
Bangladeshis
2.5
/100
|
#233
Tragic
34.4%
Immigrants | Zaire
2.3
/100
|
#234
Tragic
34.5%
Immigrants | Ghana
2.2
/100
|
#235
Tragic
34.5%
Immigrants | Cameroon
1.6
/100
|
#236
Tragic
34.7%
Marshallese
1.6
/100
|
#237
Tragic
34.8%
Immigrants | Cambodia
1.6
/100
|
#238
Tragic
34.8%
Sierra Leoneans
1.4
/100
|
#239
Tragic
34.9%
Immigrants | Middle Africa
1.2
/100
|
#240
Tragic
34.9%
Immigrants | Guyana
1.2
/100
|
#241
Tragic
35.0%
Indonesians
1.2
/100
|
#242
Tragic
35.0%
Japanese
0.9
/100
|
#243
Tragic
35.2%
Guyanese
0.9
/100
|
#244
Tragic
35.2%