Immigrants from Bolivia vs Immigrants from Mexico Currently Married
COMPARE
Immigrants from Bolivia
Immigrants from Mexico
Currently Married
Currently Married Comparison
Immigrants from Bolivia
Immigrants from Mexico
47.9%
CURRENTLY MARRIED
95.6/ 100
METRIC RATING
91st/ 347
METRIC RANK
44.5%
CURRENTLY MARRIED
0.7/ 100
METRIC RATING
239th/ 347
METRIC RANK
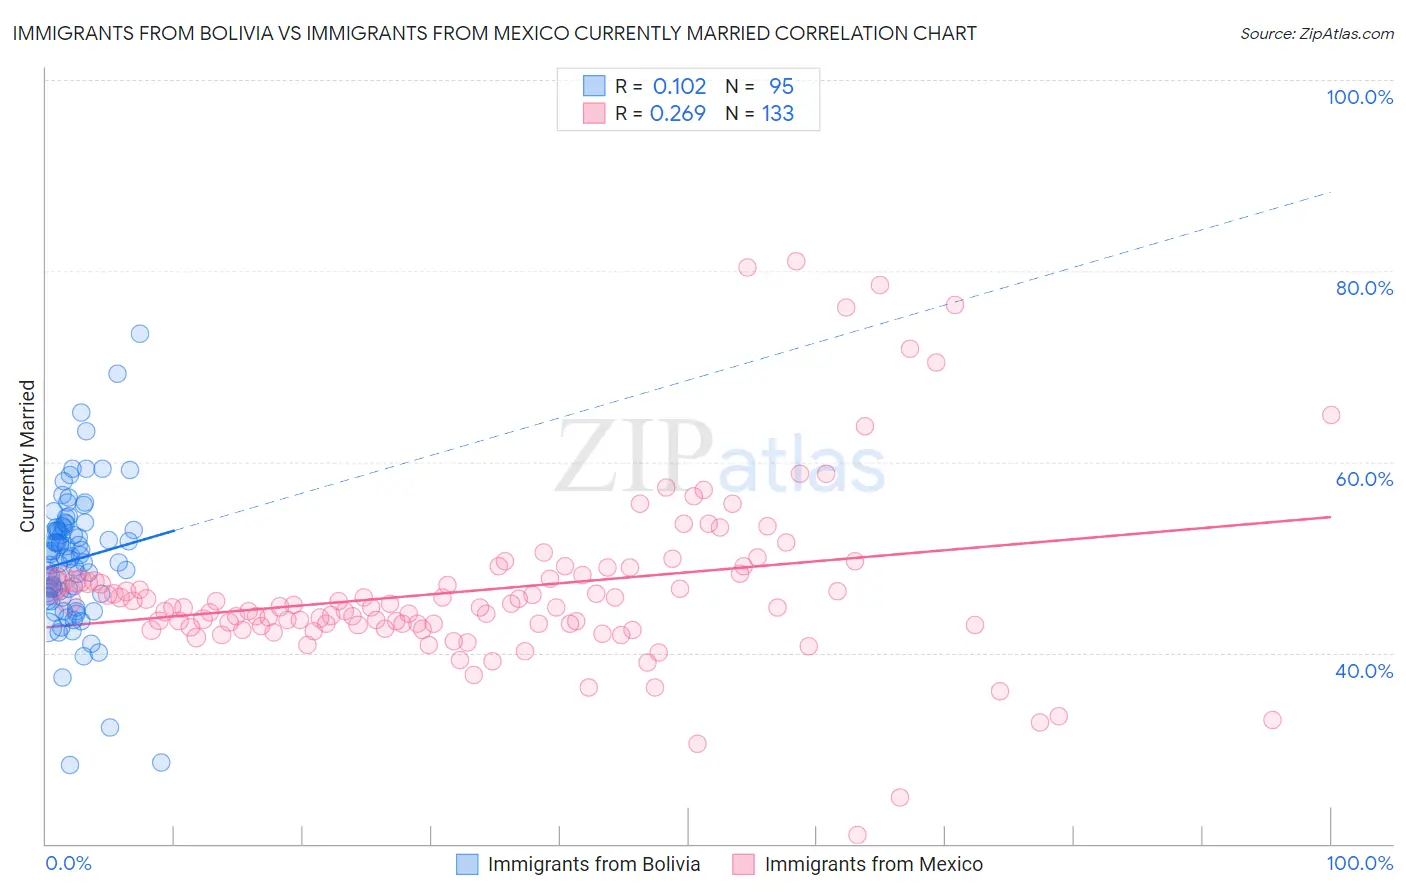
Immigrants from Bolivia vs Immigrants from Mexico Currently Married Correlation Chart
The statistical analysis conducted on geographies consisting of 158,725,888 people shows a poor positive correlation between the proportion of Immigrants from Bolivia and percentage of population currently married in the United States with a correlation coefficient (R) of 0.102 and weighted average of 47.9%. Similarly, the statistical analysis conducted on geographies consisting of 513,698,196 people shows a weak positive correlation between the proportion of Immigrants from Mexico and percentage of population currently married in the United States with a correlation coefficient (R) of 0.269 and weighted average of 44.5%, a difference of 7.6%.
Currently Married Correlation Summary
| Measurement | Immigrants from Bolivia | Immigrants from Mexico |
| Minimum | 28.3% | 20.9% |
| Maximum | 73.4% | 81.0% |
| Range | 45.1% | 60.1% |
| Mean | 49.7% | 46.6% |
| Median | 50.0% | 44.8% |
| Interquartile 25% (IQ1) | 45.9% | 42.8% |
| Interquartile 75% (IQ3) | 53.1% | 47.9% |
| Interquartile Range (IQR) | 7.2% | 5.1% |
| Standard Deviation (Sample) | 7.0% | 9.3% |
| Standard Deviation (Population) | 7.0% | 9.2% |
Similar Demographics by Currently Married
Demographics Similar to Immigrants from Bolivia by Currently Married
In terms of currently married, the demographic groups most similar to Immigrants from Bolivia are American (48.0%, a difference of 0.030%), Korean (47.9%, a difference of 0.040%), Indian (Asian) (48.0%, a difference of 0.050%), Lebanese (47.9%, a difference of 0.090%), and Native Hawaiian (47.9%, a difference of 0.11%).
| Demographics | Rating | Rank | Currently Married |
| Immigrants | Israel | 96.9 /100 | #84 | Exceptional 48.1% |
| French Canadians | 96.3 /100 | #85 | Exceptional 48.0% |
| Immigrants | Japan | 96.2 /100 | #86 | Exceptional 48.0% |
| Jordanians | 96.2 /100 | #87 | Exceptional 48.0% |
| Immigrants | Eastern Europe | 96.1 /100 | #88 | Exceptional 48.0% |
| Indians (Asian) | 95.8 /100 | #89 | Exceptional 48.0% |
| Americans | 95.7 /100 | #90 | Exceptional 48.0% |
| Immigrants | Bolivia | 95.6 /100 | #91 | Exceptional 47.9% |
| Koreans | 95.4 /100 | #92 | Exceptional 47.9% |
| Lebanese | 95.1 /100 | #93 | Exceptional 47.9% |
| Native Hawaiians | 95.0 /100 | #94 | Exceptional 47.9% |
| Immigrants | Bulgaria | 94.8 /100 | #95 | Exceptional 47.9% |
| Egyptians | 94.8 /100 | #96 | Exceptional 47.9% |
| Immigrants | Ukraine | 94.8 /100 | #97 | Exceptional 47.9% |
| Immigrants | China | 94.7 /100 | #98 | Exceptional 47.9% |
Demographics Similar to Immigrants from Mexico by Currently Married
In terms of currently married, the demographic groups most similar to Immigrants from Mexico are Mexican American Indian (44.5%, a difference of 0.0%), Ethiopian (44.5%, a difference of 0.060%), Immigrants from Cambodia (44.5%, a difference of 0.090%), Immigrants from Ethiopia (44.5%, a difference of 0.10%), and Moroccan (44.6%, a difference of 0.14%).
| Demographics | Rating | Rank | Currently Married |
| Nepalese | 1.2 /100 | #232 | Tragic 44.7% |
| Immigrants | Saudi Arabia | 1.1 /100 | #233 | Tragic 44.7% |
| Iroquois | 1.1 /100 | #234 | Tragic 44.7% |
| Alaskan Athabascans | 0.9 /100 | #235 | Tragic 44.6% |
| Cubans | 0.9 /100 | #236 | Tragic 44.6% |
| Seminole | 0.9 /100 | #237 | Tragic 44.6% |
| Moroccans | 0.9 /100 | #238 | Tragic 44.6% |
| Immigrants | Mexico | 0.7 /100 | #239 | Tragic 44.5% |
| Mexican American Indians | 0.7 /100 | #240 | Tragic 44.5% |
| Ethiopians | 0.7 /100 | #241 | Tragic 44.5% |
| Immigrants | Cambodia | 0.7 /100 | #242 | Tragic 44.5% |
| Immigrants | Ethiopia | 0.7 /100 | #243 | Tragic 44.5% |
| Japanese | 0.6 /100 | #244 | Tragic 44.5% |
| Immigrants | Armenia | 0.4 /100 | #245 | Tragic 44.3% |
| Immigrants | Burma/Myanmar | 0.4 /100 | #246 | Tragic 44.3% |