Immigrants from Africa vs Immigrants from Oceania Births to Unmarried Women
COMPARE
Immigrants from Africa
Immigrants from Oceania
Births to Unmarried Women
Births to Unmarried Women Comparison
Immigrants from Africa
Immigrants from Oceania
33.0%
BIRTHS TO UNMARRIED WOMEN
14.3/ 100
METRIC RATING
204th/ 347
METRIC RANK
30.6%
BIRTHS TO UNMARRIED WOMEN
81.2/ 100
METRIC RATING
147th/ 347
METRIC RANK
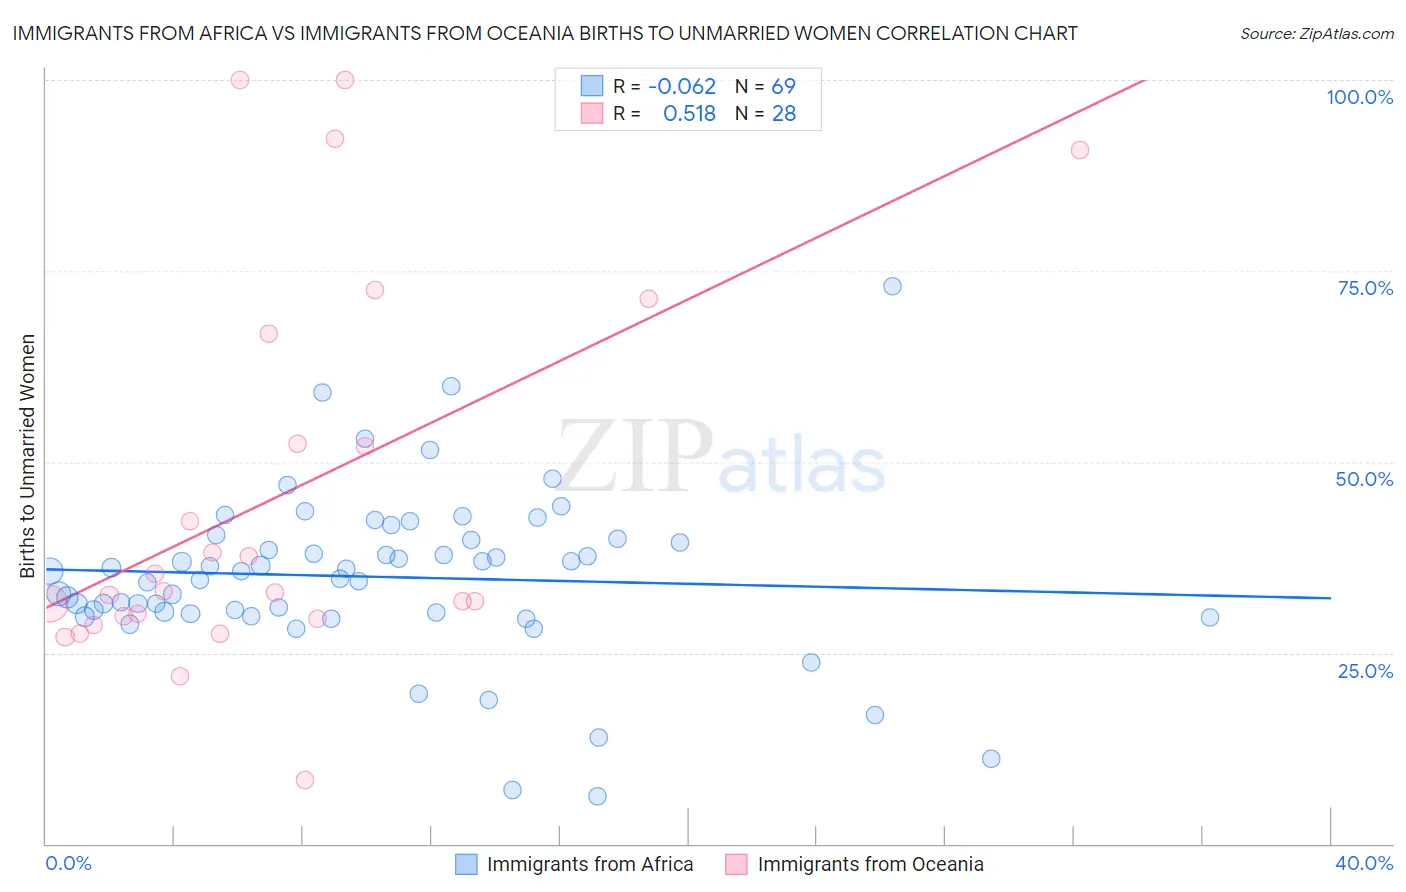
Immigrants from Africa vs Immigrants from Oceania Births to Unmarried Women Correlation Chart
The statistical analysis conducted on geographies consisting of 434,308,086 people shows a slight negative correlation between the proportion of Immigrants from Africa and percentage of births to unmarried women in the United States with a correlation coefficient (R) of -0.062 and weighted average of 33.0%. Similarly, the statistical analysis conducted on geographies consisting of 287,126,305 people shows a substantial positive correlation between the proportion of Immigrants from Oceania and percentage of births to unmarried women in the United States with a correlation coefficient (R) of 0.518 and weighted average of 30.6%, a difference of 8.0%.
Births to Unmarried Women Correlation Summary
| Measurement | Immigrants from Africa | Immigrants from Oceania |
| Minimum | 6.3% | 8.4% |
| Maximum | 73.0% | 100.0% |
| Range | 66.7% | 91.6% |
| Mean | 35.0% | 45.6% |
| Median | 35.7% | 33.0% |
| Interquartile 25% (IQ1) | 30.1% | 29.6% |
| Interquartile 75% (IQ3) | 39.8% | 59.6% |
| Interquartile Range (IQR) | 9.7% | 29.9% |
| Standard Deviation (Sample) | 11.0% | 25.4% |
| Standard Deviation (Population) | 10.9% | 24.9% |
Similar Demographics by Births to Unmarried Women
Demographics Similar to Immigrants from Africa by Births to Unmarried Women
In terms of births to unmarried women, the demographic groups most similar to Immigrants from Africa are Ute (33.0%, a difference of 0.020%), German Russian (33.1%, a difference of 0.23%), Uruguayan (33.1%, a difference of 0.29%), Immigrants from Micronesia (32.9%, a difference of 0.40%), and Immigrants from Burma/Myanmar (32.9%, a difference of 0.41%).
| Demographics | Rating | Rank | Births to Unmarried Women |
| Immigrants | Immigrants | 20.6 /100 | #197 | Fair 32.7% |
| Costa Ricans | 20.3 /100 | #198 | Fair 32.7% |
| Immigrants | Thailand | 18.9 /100 | #199 | Poor 32.8% |
| Immigrants | Germany | 18.8 /100 | #200 | Poor 32.8% |
| Immigrants | Burma/Myanmar | 16.7 /100 | #201 | Poor 32.9% |
| Immigrants | Micronesia | 16.6 /100 | #202 | Poor 32.9% |
| Ute | 14.4 /100 | #203 | Poor 33.0% |
| Immigrants | Africa | 14.3 /100 | #204 | Poor 33.0% |
| German Russians | 13.1 /100 | #205 | Poor 33.1% |
| Uruguayans | 12.8 /100 | #206 | Poor 33.1% |
| Immigrants | Sudan | 11.5 /100 | #207 | Poor 33.2% |
| Hawaiians | 11.3 /100 | #208 | Poor 33.2% |
| Whites/Caucasians | 10.7 /100 | #209 | Poor 33.3% |
| Scotch-Irish | 10.7 /100 | #210 | Poor 33.3% |
| Ecuadorians | 10.5 /100 | #211 | Poor 33.3% |
Demographics Similar to Immigrants from Oceania by Births to Unmarried Women
In terms of births to unmarried women, the demographic groups most similar to Immigrants from Oceania are Northern European (30.6%, a difference of 0.030%), Immigrants from North America (30.6%, a difference of 0.050%), Czech (30.5%, a difference of 0.15%), Immigrants from Uganda (30.5%, a difference of 0.22%), and South African (30.5%, a difference of 0.24%).
| Demographics | Rating | Rank | Births to Unmarried Women |
| Swiss | 83.1 /100 | #140 | Excellent 30.5% |
| Pakistanis | 83.0 /100 | #141 | Excellent 30.5% |
| South Africans | 82.7 /100 | #142 | Excellent 30.5% |
| Immigrants | Uganda | 82.6 /100 | #143 | Excellent 30.5% |
| Czechs | 82.1 /100 | #144 | Excellent 30.5% |
| Immigrants | North America | 81.5 /100 | #145 | Excellent 30.6% |
| Northern Europeans | 81.4 /100 | #146 | Excellent 30.6% |
| Immigrants | Oceania | 81.2 /100 | #147 | Excellent 30.6% |
| Chileans | 79.1 /100 | #148 | Good 30.7% |
| Serbians | 78.8 /100 | #149 | Good 30.7% |
| Somalis | 77.8 /100 | #150 | Good 30.7% |
| Italians | 77.0 /100 | #151 | Good 30.8% |
| Poles | 76.2 /100 | #152 | Good 30.8% |
| British | 76.0 /100 | #153 | Good 30.8% |
| Yugoslavians | 75.1 /100 | #154 | Good 30.8% |