Fijian vs Immigrants from Oceania Births to Unmarried Women
COMPARE
Fijian
Immigrants from Oceania
Births to Unmarried Women
Births to Unmarried Women Comparison
Fijians
Immigrants from Oceania
32.3%
BIRTHS TO UNMARRIED WOMEN
31.1/ 100
METRIC RATING
193rd/ 347
METRIC RANK
30.6%
BIRTHS TO UNMARRIED WOMEN
81.2/ 100
METRIC RATING
147th/ 347
METRIC RANK
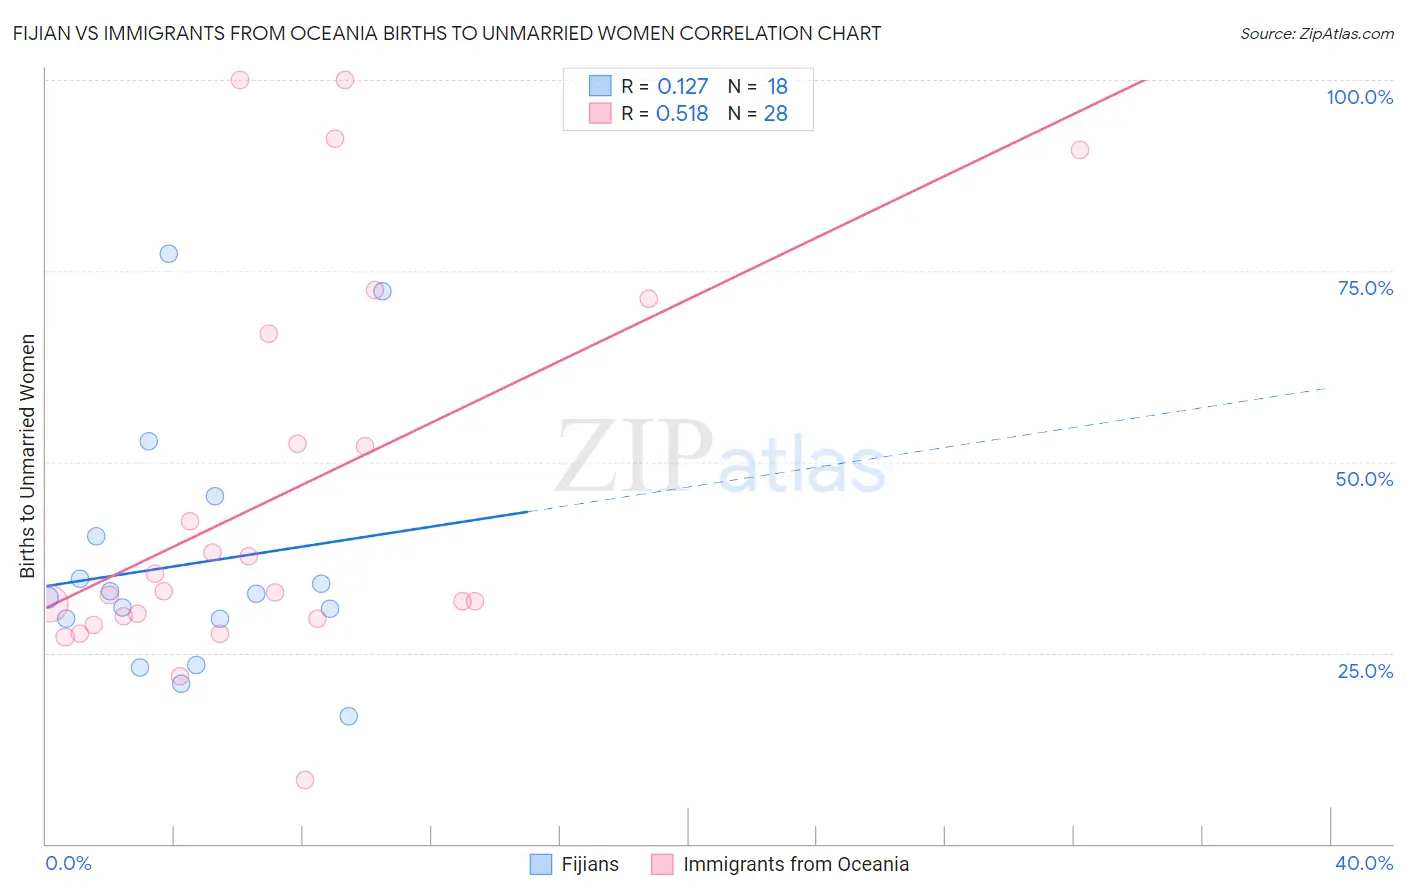
Fijian vs Immigrants from Oceania Births to Unmarried Women Correlation Chart
The statistical analysis conducted on geographies consisting of 54,941,736 people shows a poor positive correlation between the proportion of Fijians and percentage of births to unmarried women in the United States with a correlation coefficient (R) of 0.127 and weighted average of 32.3%. Similarly, the statistical analysis conducted on geographies consisting of 287,126,305 people shows a substantial positive correlation between the proportion of Immigrants from Oceania and percentage of births to unmarried women in the United States with a correlation coefficient (R) of 0.518 and weighted average of 30.6%, a difference of 5.5%.
Births to Unmarried Women Correlation Summary
| Measurement | Fijian | Immigrants from Oceania |
| Minimum | 16.7% | 8.4% |
| Maximum | 77.3% | 100.0% |
| Range | 60.6% | 91.6% |
| Mean | 36.6% | 45.6% |
| Median | 32.4% | 33.0% |
| Interquartile 25% (IQ1) | 29.4% | 29.6% |
| Interquartile 75% (IQ3) | 40.3% | 59.6% |
| Interquartile Range (IQR) | 10.9% | 29.9% |
| Standard Deviation (Sample) | 16.3% | 25.4% |
| Standard Deviation (Population) | 15.8% | 24.9% |
Similar Demographics by Births to Unmarried Women
Demographics Similar to Fijians by Births to Unmarried Women
In terms of births to unmarried women, the demographic groups most similar to Fijians are Colombian (32.2%, a difference of 0.090%), Irish (32.2%, a difference of 0.14%), Tlingit-Haida (32.2%, a difference of 0.17%), Sudanese (32.4%, a difference of 0.42%), and Immigrants from Kenya (32.1%, a difference of 0.61%).
| Demographics | Rating | Rank | Births to Unmarried Women |
| Welsh | 38.2 /100 | #186 | Fair 32.0% |
| Czechoslovakians | 38.0 /100 | #187 | Fair 32.0% |
| Osage | 37.1 /100 | #188 | Fair 32.1% |
| Immigrants | Kenya | 36.9 /100 | #189 | Fair 32.1% |
| Tlingit-Haida | 32.6 /100 | #190 | Fair 32.2% |
| Irish | 32.4 /100 | #191 | Fair 32.2% |
| Colombians | 31.9 /100 | #192 | Fair 32.2% |
| Fijians | 31.1 /100 | #193 | Fair 32.3% |
| Sudanese | 27.3 /100 | #194 | Fair 32.4% |
| Samoans | 21.9 /100 | #195 | Fair 32.6% |
| Immigrants | Colombia | 21.7 /100 | #196 | Fair 32.6% |
| Immigrants | Immigrants | 20.6 /100 | #197 | Fair 32.7% |
| Costa Ricans | 20.3 /100 | #198 | Fair 32.7% |
| Immigrants | Thailand | 18.9 /100 | #199 | Poor 32.8% |
| Immigrants | Germany | 18.8 /100 | #200 | Poor 32.8% |
Demographics Similar to Immigrants from Oceania by Births to Unmarried Women
In terms of births to unmarried women, the demographic groups most similar to Immigrants from Oceania are Northern European (30.6%, a difference of 0.030%), Immigrants from North America (30.6%, a difference of 0.050%), Czech (30.5%, a difference of 0.15%), Immigrants from Uganda (30.5%, a difference of 0.22%), and South African (30.5%, a difference of 0.24%).
| Demographics | Rating | Rank | Births to Unmarried Women |
| Swiss | 83.1 /100 | #140 | Excellent 30.5% |
| Pakistanis | 83.0 /100 | #141 | Excellent 30.5% |
| South Africans | 82.7 /100 | #142 | Excellent 30.5% |
| Immigrants | Uganda | 82.6 /100 | #143 | Excellent 30.5% |
| Czechs | 82.1 /100 | #144 | Excellent 30.5% |
| Immigrants | North America | 81.5 /100 | #145 | Excellent 30.6% |
| Northern Europeans | 81.4 /100 | #146 | Excellent 30.6% |
| Immigrants | Oceania | 81.2 /100 | #147 | Excellent 30.6% |
| Chileans | 79.1 /100 | #148 | Good 30.7% |
| Serbians | 78.8 /100 | #149 | Good 30.7% |
| Somalis | 77.8 /100 | #150 | Good 30.7% |
| Italians | 77.0 /100 | #151 | Good 30.8% |
| Poles | 76.2 /100 | #152 | Good 30.8% |
| British | 76.0 /100 | #153 | Good 30.8% |
| Yugoslavians | 75.1 /100 | #154 | Good 30.8% |