Argentinean vs Immigrants from Oceania Births to Unmarried Women
COMPARE
Argentinean
Immigrants from Oceania
Births to Unmarried Women
Births to Unmarried Women Comparison
Argentineans
Immigrants from Oceania
30.0%
BIRTHS TO UNMARRIED WOMEN
90.5/ 100
METRIC RATING
119th/ 347
METRIC RANK
30.6%
BIRTHS TO UNMARRIED WOMEN
81.2/ 100
METRIC RATING
147th/ 347
METRIC RANK
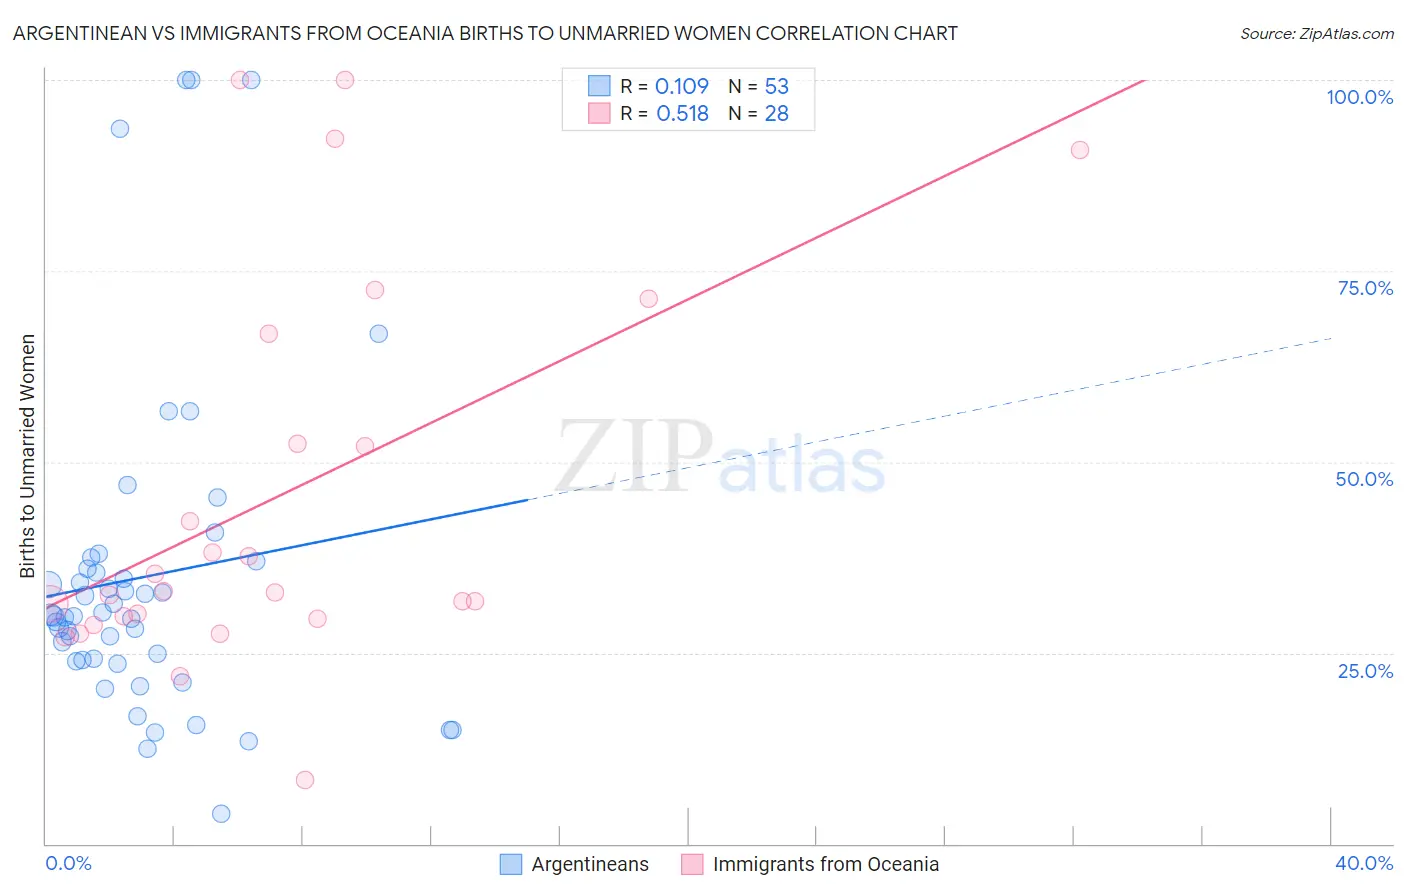
Argentinean vs Immigrants from Oceania Births to Unmarried Women Correlation Chart
The statistical analysis conducted on geographies consisting of 280,462,153 people shows a poor positive correlation between the proportion of Argentineans and percentage of births to unmarried women in the United States with a correlation coefficient (R) of 0.109 and weighted average of 30.0%. Similarly, the statistical analysis conducted on geographies consisting of 287,126,305 people shows a substantial positive correlation between the proportion of Immigrants from Oceania and percentage of births to unmarried women in the United States with a correlation coefficient (R) of 0.518 and weighted average of 30.6%, a difference of 2.0%.
Births to Unmarried Women Correlation Summary
| Measurement | Argentinean | Immigrants from Oceania |
| Minimum | 4.0% | 8.4% |
| Maximum | 100.0% | 100.0% |
| Range | 96.0% | 91.6% |
| Mean | 34.9% | 45.6% |
| Median | 29.9% | 33.0% |
| Interquartile 25% (IQ1) | 24.0% | 29.6% |
| Interquartile 75% (IQ3) | 36.5% | 59.6% |
| Interquartile Range (IQR) | 12.5% | 29.9% |
| Standard Deviation (Sample) | 21.5% | 25.4% |
| Standard Deviation (Population) | 21.3% | 24.9% |
Similar Demographics by Births to Unmarried Women
Demographics Similar to Argentineans by Births to Unmarried Women
In terms of births to unmarried women, the demographic groups most similar to Argentineans are Immigrants from Norway (29.9%, a difference of 0.14%), Immigrants from Netherlands (29.9%, a difference of 0.16%), Ugandan (30.1%, a difference of 0.36%), Immigrants from Italy (29.9%, a difference of 0.37%), and Korean (30.1%, a difference of 0.44%).
| Demographics | Rating | Rank | Births to Unmarried Women |
| Basques | 93.0 /100 | #112 | Exceptional 29.7% |
| Scandinavians | 92.7 /100 | #113 | Exceptional 29.8% |
| Immigrants | Croatia | 92.6 /100 | #114 | Exceptional 29.8% |
| Ethiopians | 91.9 /100 | #115 | Exceptional 29.8% |
| Immigrants | Italy | 91.7 /100 | #116 | Exceptional 29.9% |
| Immigrants | Netherlands | 91.1 /100 | #117 | Exceptional 29.9% |
| Immigrants | Norway | 91.0 /100 | #118 | Exceptional 29.9% |
| Argentineans | 90.5 /100 | #119 | Exceptional 30.0% |
| Ugandans | 89.2 /100 | #120 | Excellent 30.1% |
| Koreans | 88.9 /100 | #121 | Excellent 30.1% |
| Immigrants | Argentina | 88.7 /100 | #122 | Excellent 30.1% |
| Syrians | 88.2 /100 | #123 | Excellent 30.2% |
| Croatians | 88.0 /100 | #124 | Excellent 30.2% |
| Vietnamese | 87.7 /100 | #125 | Excellent 30.2% |
| Europeans | 87.2 /100 | #126 | Excellent 30.2% |
Demographics Similar to Immigrants from Oceania by Births to Unmarried Women
In terms of births to unmarried women, the demographic groups most similar to Immigrants from Oceania are Northern European (30.6%, a difference of 0.030%), Immigrants from North America (30.6%, a difference of 0.050%), Czech (30.5%, a difference of 0.15%), Immigrants from Uganda (30.5%, a difference of 0.22%), and South African (30.5%, a difference of 0.24%).
| Demographics | Rating | Rank | Births to Unmarried Women |
| Swiss | 83.1 /100 | #140 | Excellent 30.5% |
| Pakistanis | 83.0 /100 | #141 | Excellent 30.5% |
| South Africans | 82.7 /100 | #142 | Excellent 30.5% |
| Immigrants | Uganda | 82.6 /100 | #143 | Excellent 30.5% |
| Czechs | 82.1 /100 | #144 | Excellent 30.5% |
| Immigrants | North America | 81.5 /100 | #145 | Excellent 30.6% |
| Northern Europeans | 81.4 /100 | #146 | Excellent 30.6% |
| Immigrants | Oceania | 81.2 /100 | #147 | Excellent 30.6% |
| Chileans | 79.1 /100 | #148 | Good 30.7% |
| Serbians | 78.8 /100 | #149 | Good 30.7% |
| Somalis | 77.8 /100 | #150 | Good 30.7% |
| Italians | 77.0 /100 | #151 | Good 30.8% |
| Poles | 76.2 /100 | #152 | Good 30.8% |
| British | 76.0 /100 | #153 | Good 30.8% |
| Yugoslavians | 75.1 /100 | #154 | Good 30.8% |