Immigrants from Africa vs Syrian Births to Unmarried Women
COMPARE
Immigrants from Africa
Syrian
Births to Unmarried Women
Births to Unmarried Women Comparison
Immigrants from Africa
Syrians
33.0%
BIRTHS TO UNMARRIED WOMEN
14.3/ 100
METRIC RATING
204th/ 347
METRIC RANK
30.2%
BIRTHS TO UNMARRIED WOMEN
88.2/ 100
METRIC RATING
123rd/ 347
METRIC RANK
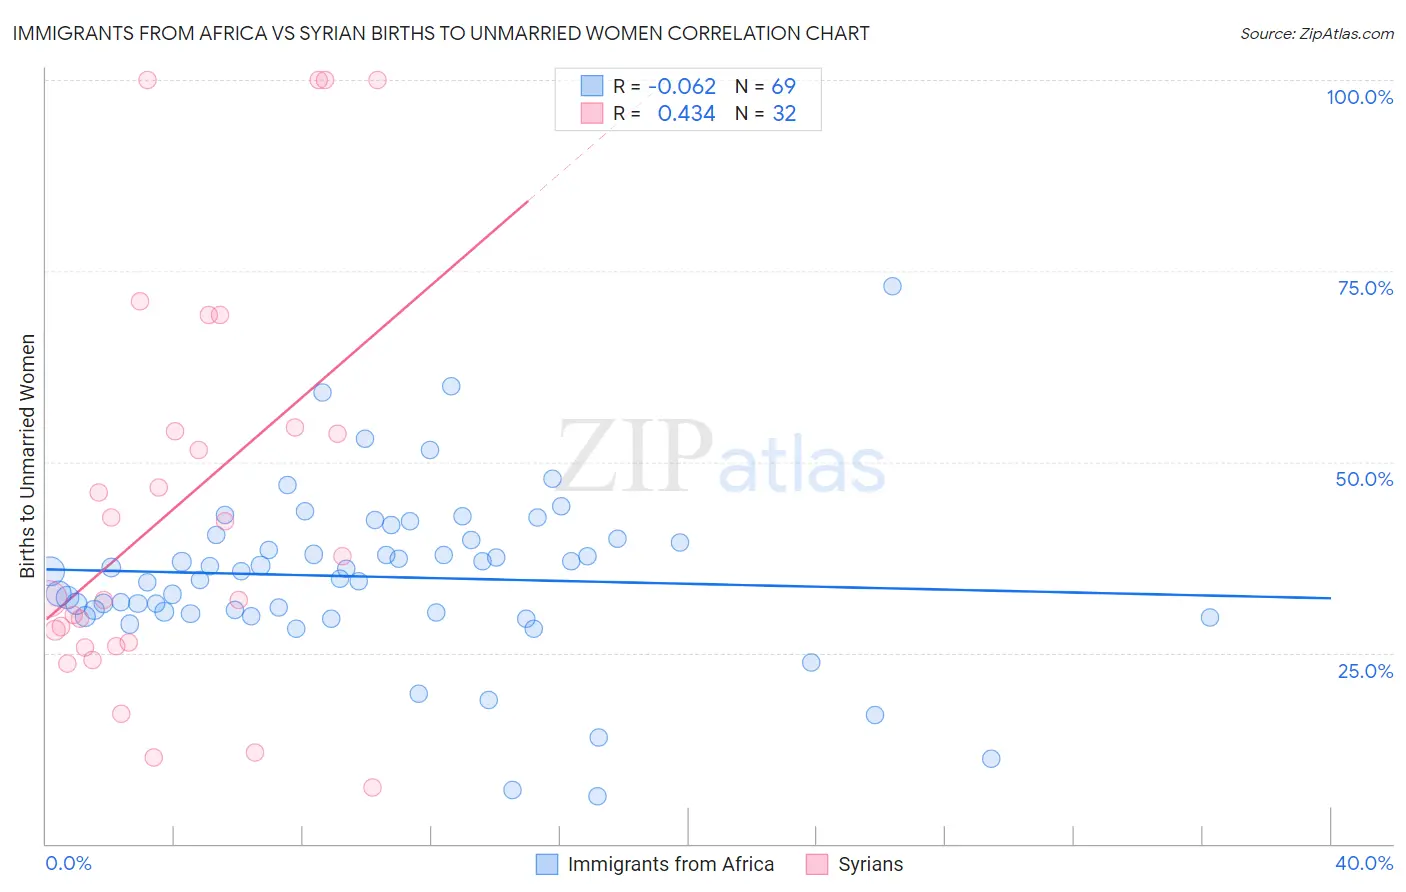
Immigrants from Africa vs Syrian Births to Unmarried Women Correlation Chart
The statistical analysis conducted on geographies consisting of 434,308,086 people shows a slight negative correlation between the proportion of Immigrants from Africa and percentage of births to unmarried women in the United States with a correlation coefficient (R) of -0.062 and weighted average of 33.0%. Similarly, the statistical analysis conducted on geographies consisting of 250,644,243 people shows a moderate positive correlation between the proportion of Syrians and percentage of births to unmarried women in the United States with a correlation coefficient (R) of 0.434 and weighted average of 30.2%, a difference of 9.4%.
Births to Unmarried Women Correlation Summary
| Measurement | Immigrants from Africa | Syrian |
| Minimum | 6.3% | 7.3% |
| Maximum | 73.0% | 100.0% |
| Range | 66.7% | 92.7% |
| Mean | 35.0% | 44.5% |
| Median | 35.7% | 34.9% |
| Interquartile 25% (IQ1) | 30.1% | 26.1% |
| Interquartile 75% (IQ3) | 39.8% | 54.3% |
| Interquartile Range (IQR) | 9.7% | 28.2% |
| Standard Deviation (Sample) | 11.0% | 26.8% |
| Standard Deviation (Population) | 10.9% | 26.4% |
Similar Demographics by Births to Unmarried Women
Demographics Similar to Immigrants from Africa by Births to Unmarried Women
In terms of births to unmarried women, the demographic groups most similar to Immigrants from Africa are Ute (33.0%, a difference of 0.020%), German Russian (33.1%, a difference of 0.23%), Uruguayan (33.1%, a difference of 0.29%), Immigrants from Micronesia (32.9%, a difference of 0.40%), and Immigrants from Burma/Myanmar (32.9%, a difference of 0.41%).
| Demographics | Rating | Rank | Births to Unmarried Women |
| Immigrants | Immigrants | 20.6 /100 | #197 | Fair 32.7% |
| Costa Ricans | 20.3 /100 | #198 | Fair 32.7% |
| Immigrants | Thailand | 18.9 /100 | #199 | Poor 32.8% |
| Immigrants | Germany | 18.8 /100 | #200 | Poor 32.8% |
| Immigrants | Burma/Myanmar | 16.7 /100 | #201 | Poor 32.9% |
| Immigrants | Micronesia | 16.6 /100 | #202 | Poor 32.9% |
| Ute | 14.4 /100 | #203 | Poor 33.0% |
| Immigrants | Africa | 14.3 /100 | #204 | Poor 33.0% |
| German Russians | 13.1 /100 | #205 | Poor 33.1% |
| Uruguayans | 12.8 /100 | #206 | Poor 33.1% |
| Immigrants | Sudan | 11.5 /100 | #207 | Poor 33.2% |
| Hawaiians | 11.3 /100 | #208 | Poor 33.2% |
| Whites/Caucasians | 10.7 /100 | #209 | Poor 33.3% |
| Scotch-Irish | 10.7 /100 | #210 | Poor 33.3% |
| Ecuadorians | 10.5 /100 | #211 | Poor 33.3% |
Demographics Similar to Syrians by Births to Unmarried Women
In terms of births to unmarried women, the demographic groups most similar to Syrians are Croatian (30.2%, a difference of 0.040%), Vietnamese (30.2%, a difference of 0.11%), Immigrants from Argentina (30.1%, a difference of 0.13%), Korean (30.1%, a difference of 0.18%), and European (30.2%, a difference of 0.23%).
| Demographics | Rating | Rank | Births to Unmarried Women |
| Immigrants | Italy | 91.7 /100 | #116 | Exceptional 29.9% |
| Immigrants | Netherlands | 91.1 /100 | #117 | Exceptional 29.9% |
| Immigrants | Norway | 91.0 /100 | #118 | Exceptional 29.9% |
| Argentineans | 90.5 /100 | #119 | Exceptional 30.0% |
| Ugandans | 89.2 /100 | #120 | Excellent 30.1% |
| Koreans | 88.9 /100 | #121 | Excellent 30.1% |
| Immigrants | Argentina | 88.7 /100 | #122 | Excellent 30.1% |
| Syrians | 88.2 /100 | #123 | Excellent 30.2% |
| Croatians | 88.0 /100 | #124 | Excellent 30.2% |
| Vietnamese | 87.7 /100 | #125 | Excellent 30.2% |
| Europeans | 87.2 /100 | #126 | Excellent 30.2% |
| Chinese | 87.1 /100 | #127 | Excellent 30.2% |
| Icelanders | 86.0 /100 | #128 | Excellent 30.3% |
| Immigrants | Spain | 85.8 /100 | #129 | Excellent 30.3% |
| Immigrants | Bosnia and Herzegovina | 85.7 /100 | #130 | Excellent 30.3% |